Analytics and Reporting
Evora Global
Context
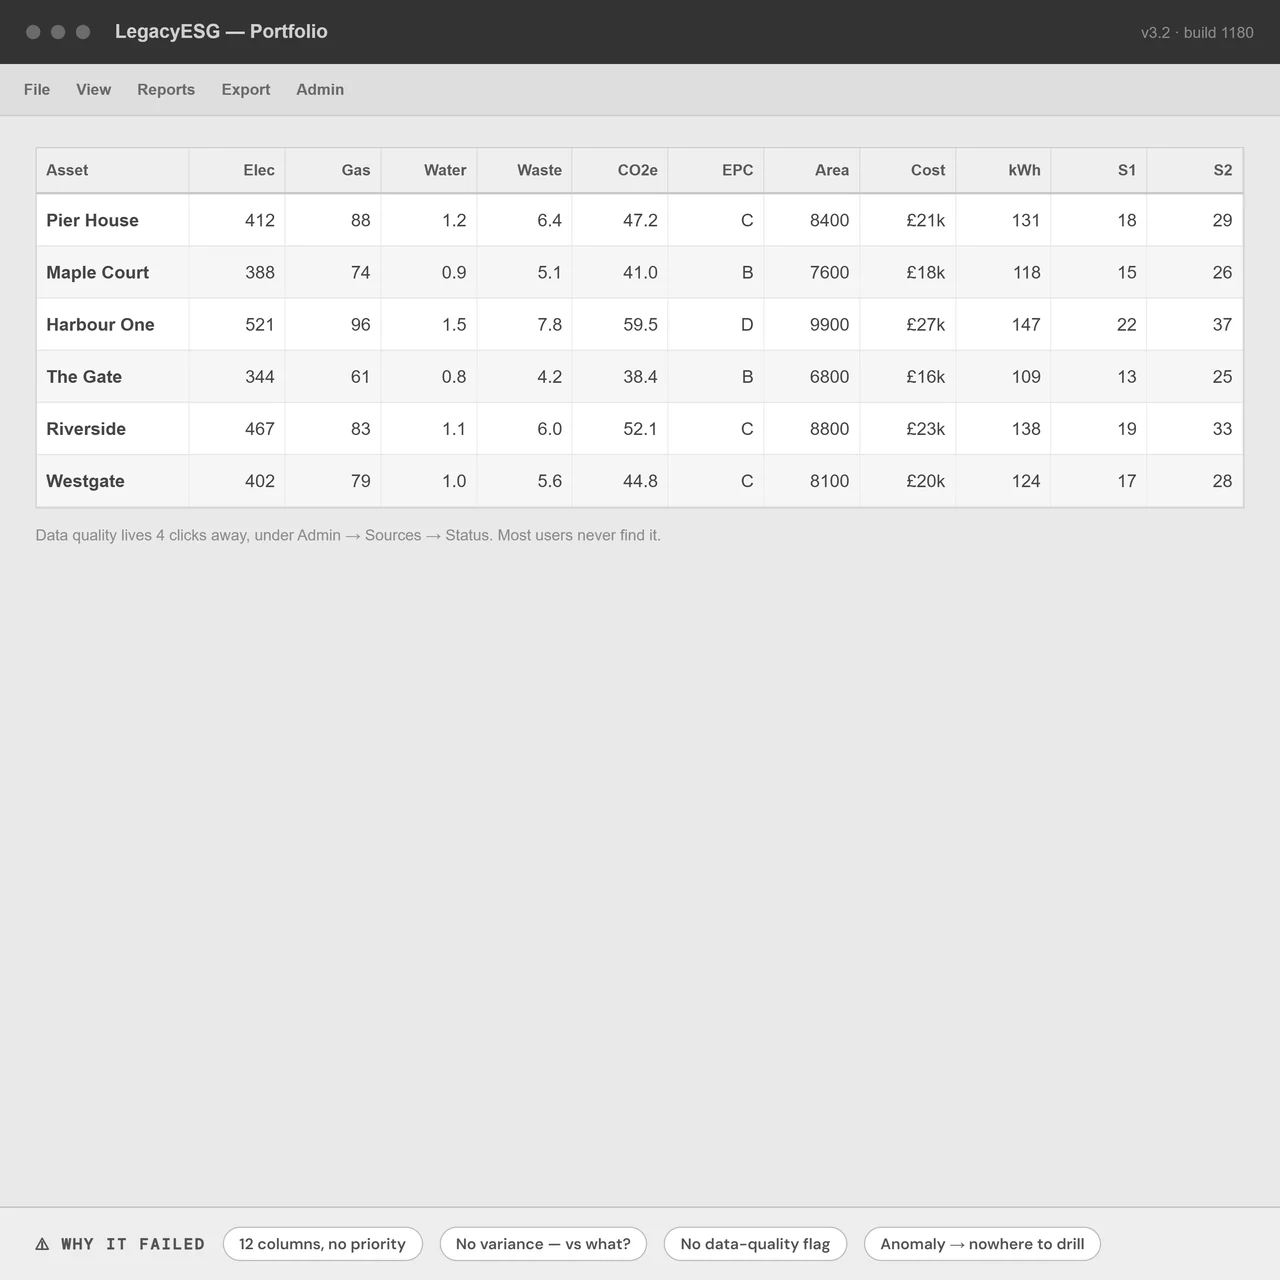
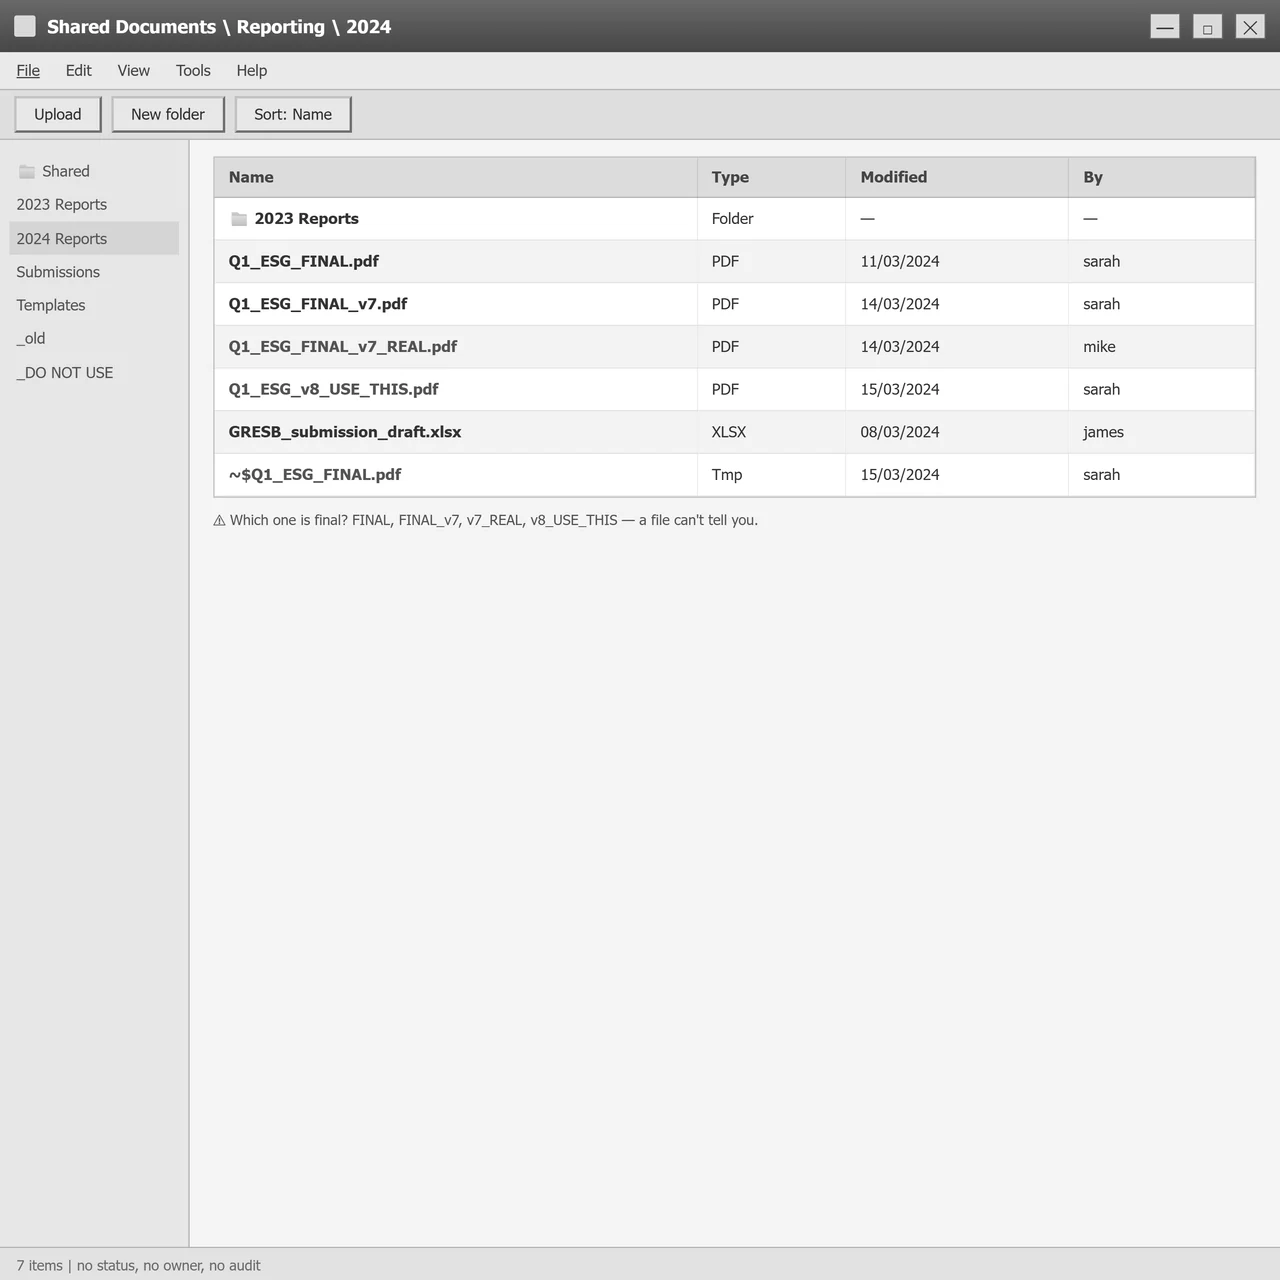
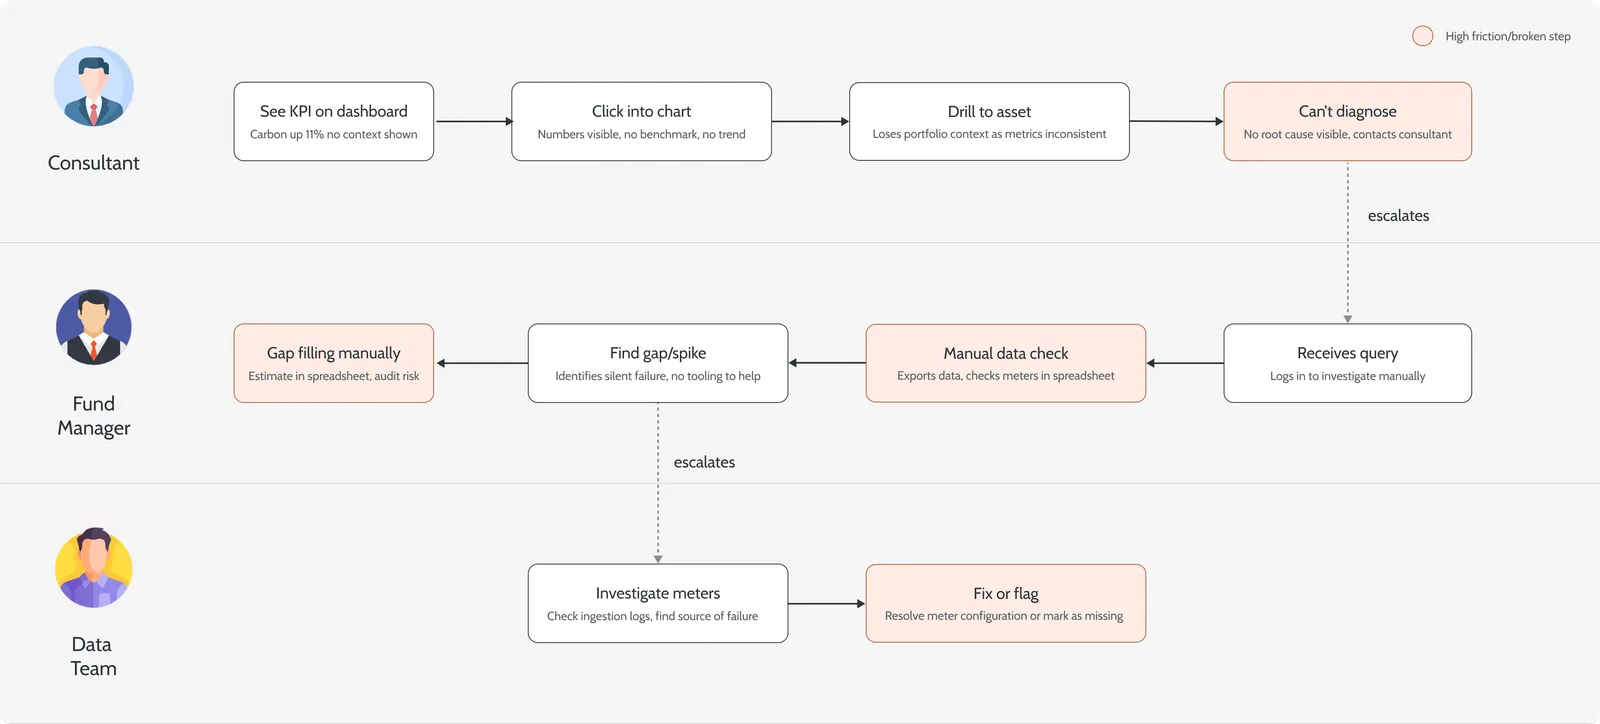
The platform stored ESG data well but interpreted it poorly. Fund managers could see figures, but not answer the questions that mattered: are we on track, which asset is the problem, can I trust this number? Reporting lived outside the product entirely, drafted in slides, signed off by email and shared as PDFs that drifted out of sync with the live data.
Approach
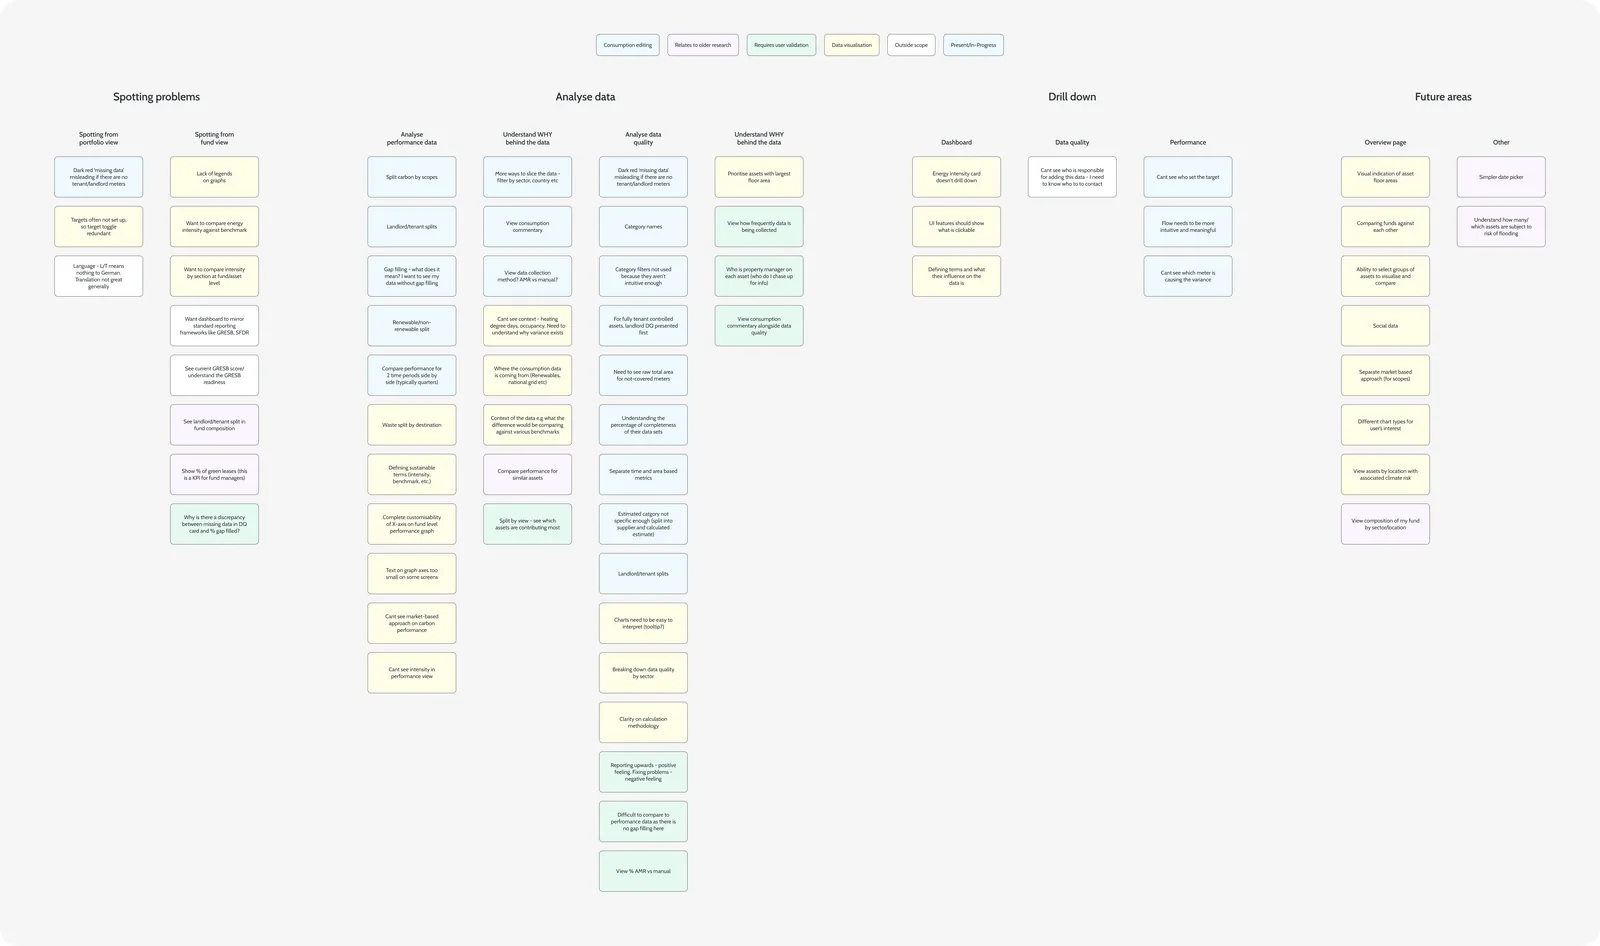
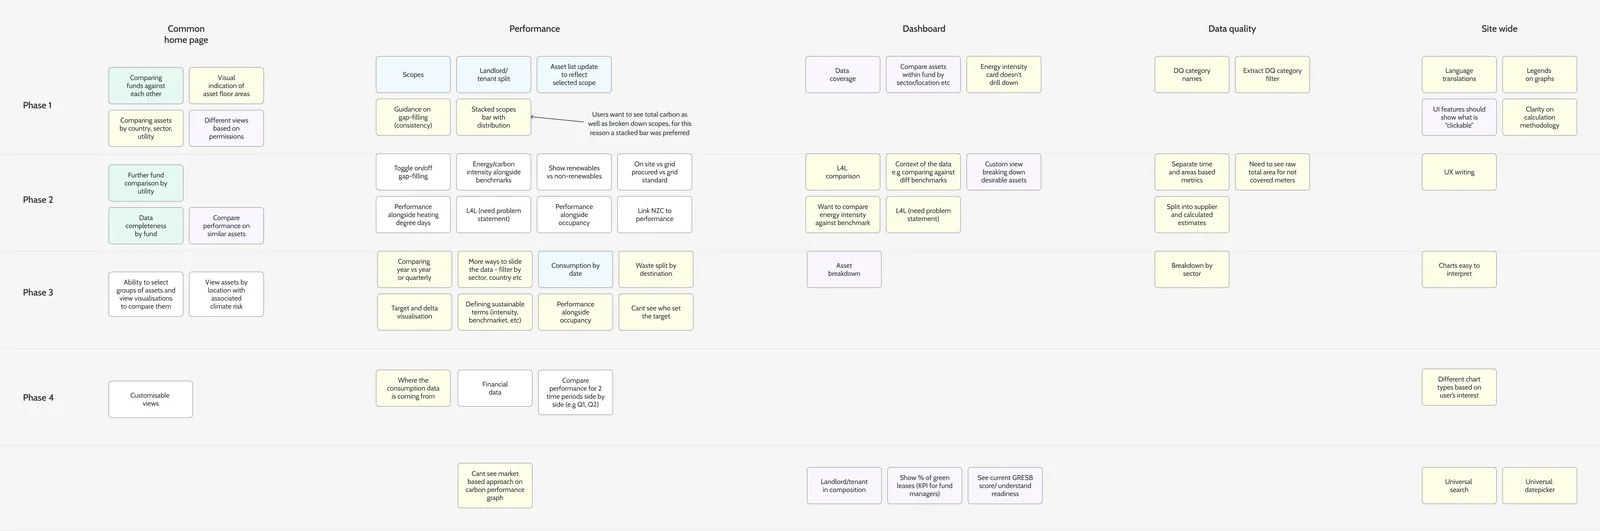
I led design for both halves, analytics first and reporting second, because a report is only as good as the data under it. Interviews with fund managers, consultants and analysts were affinity-mapped into six problem areas. Rather than run six workstreams, I sequenced them into four phases by dependency.
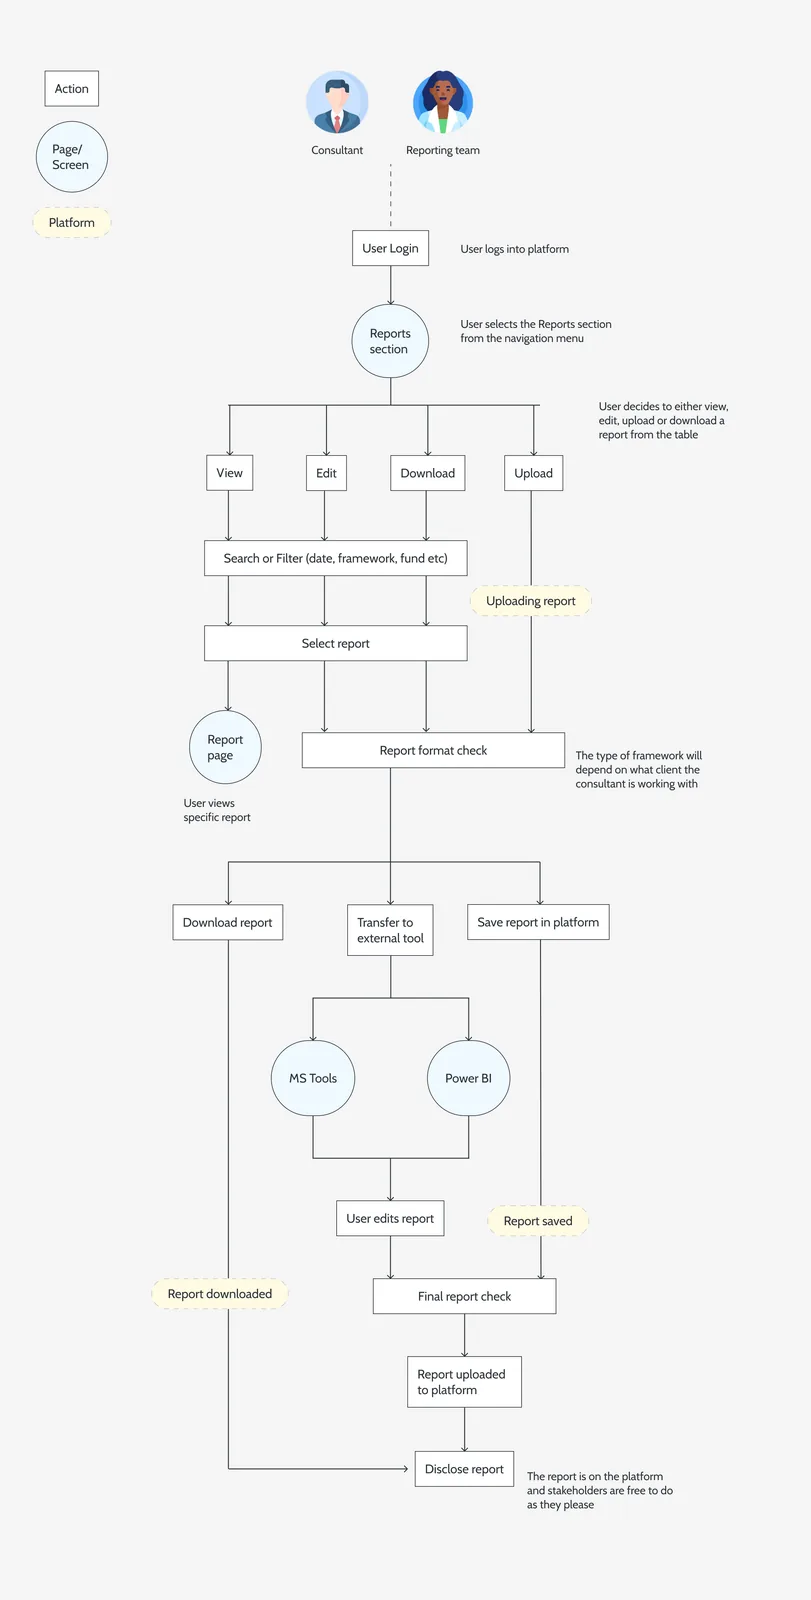
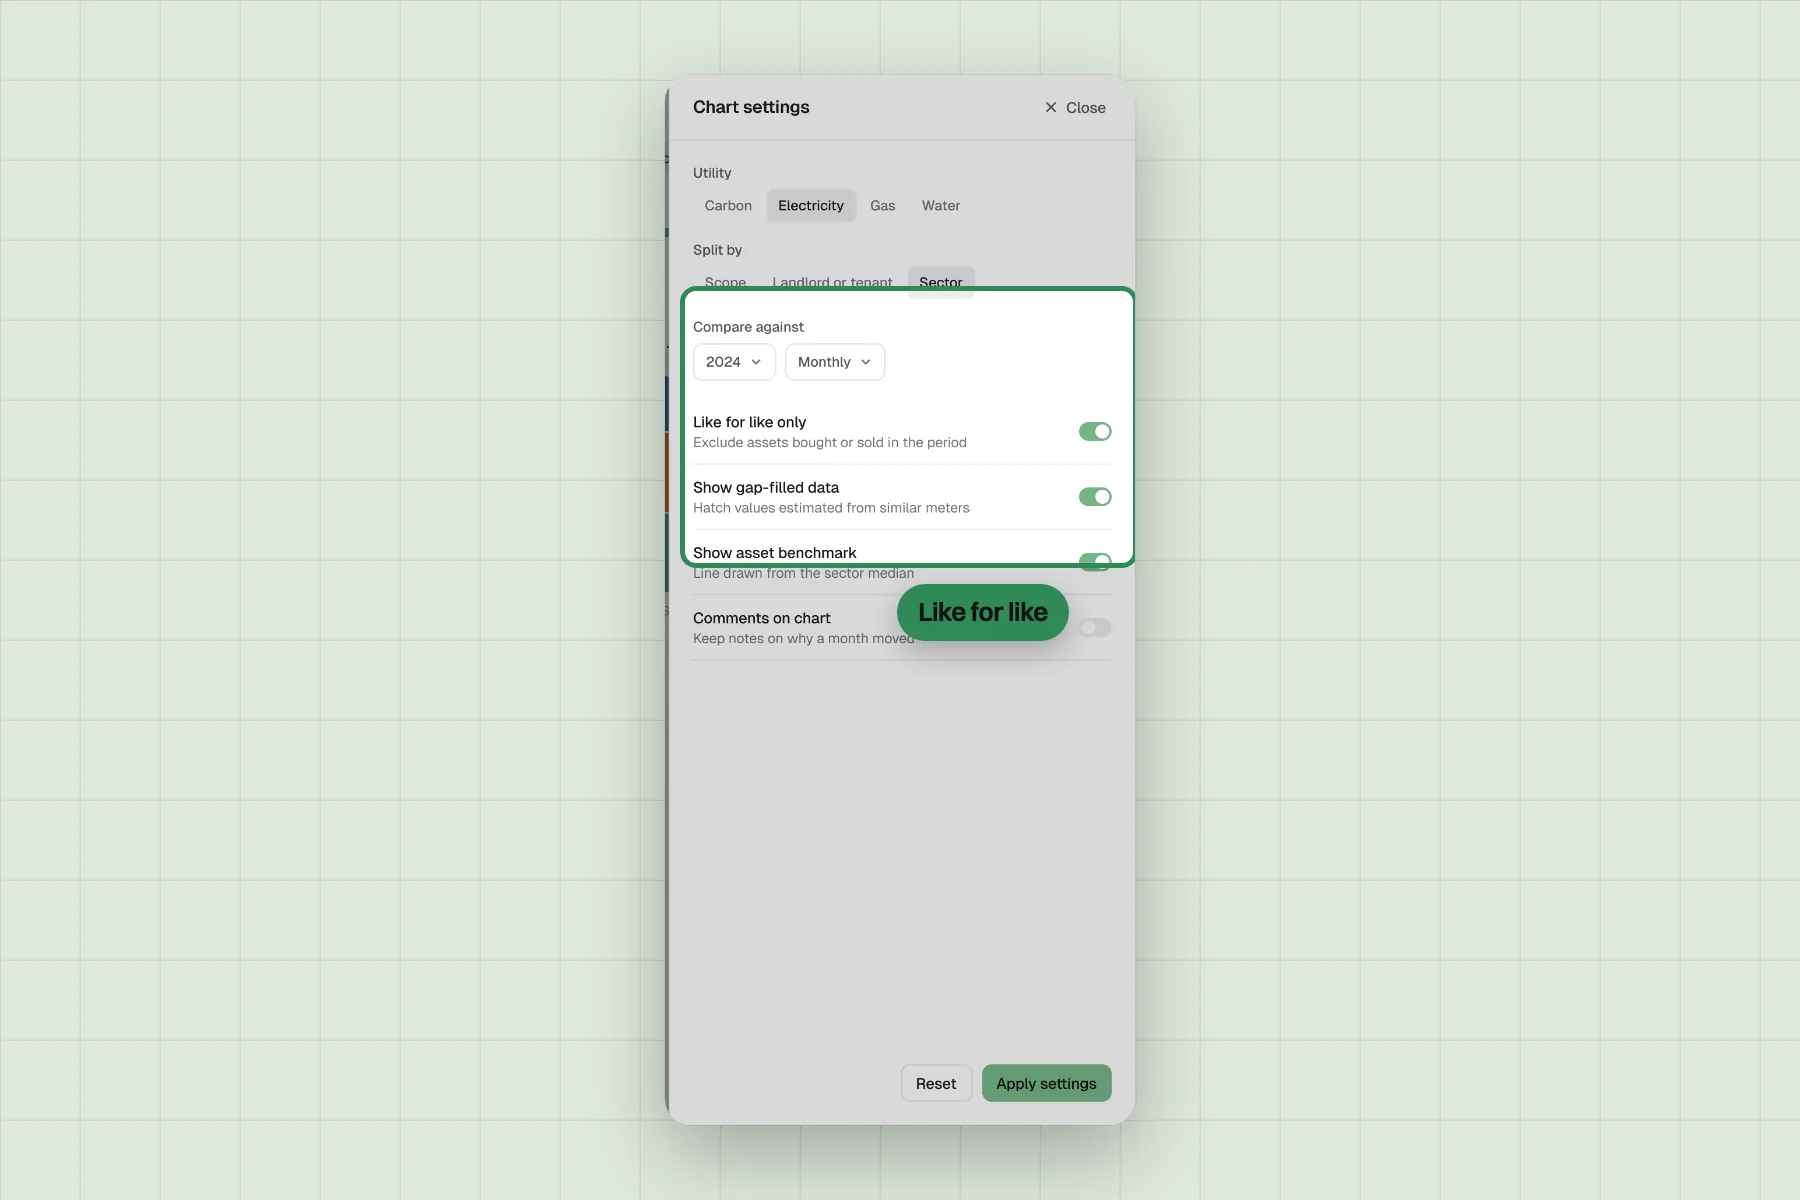
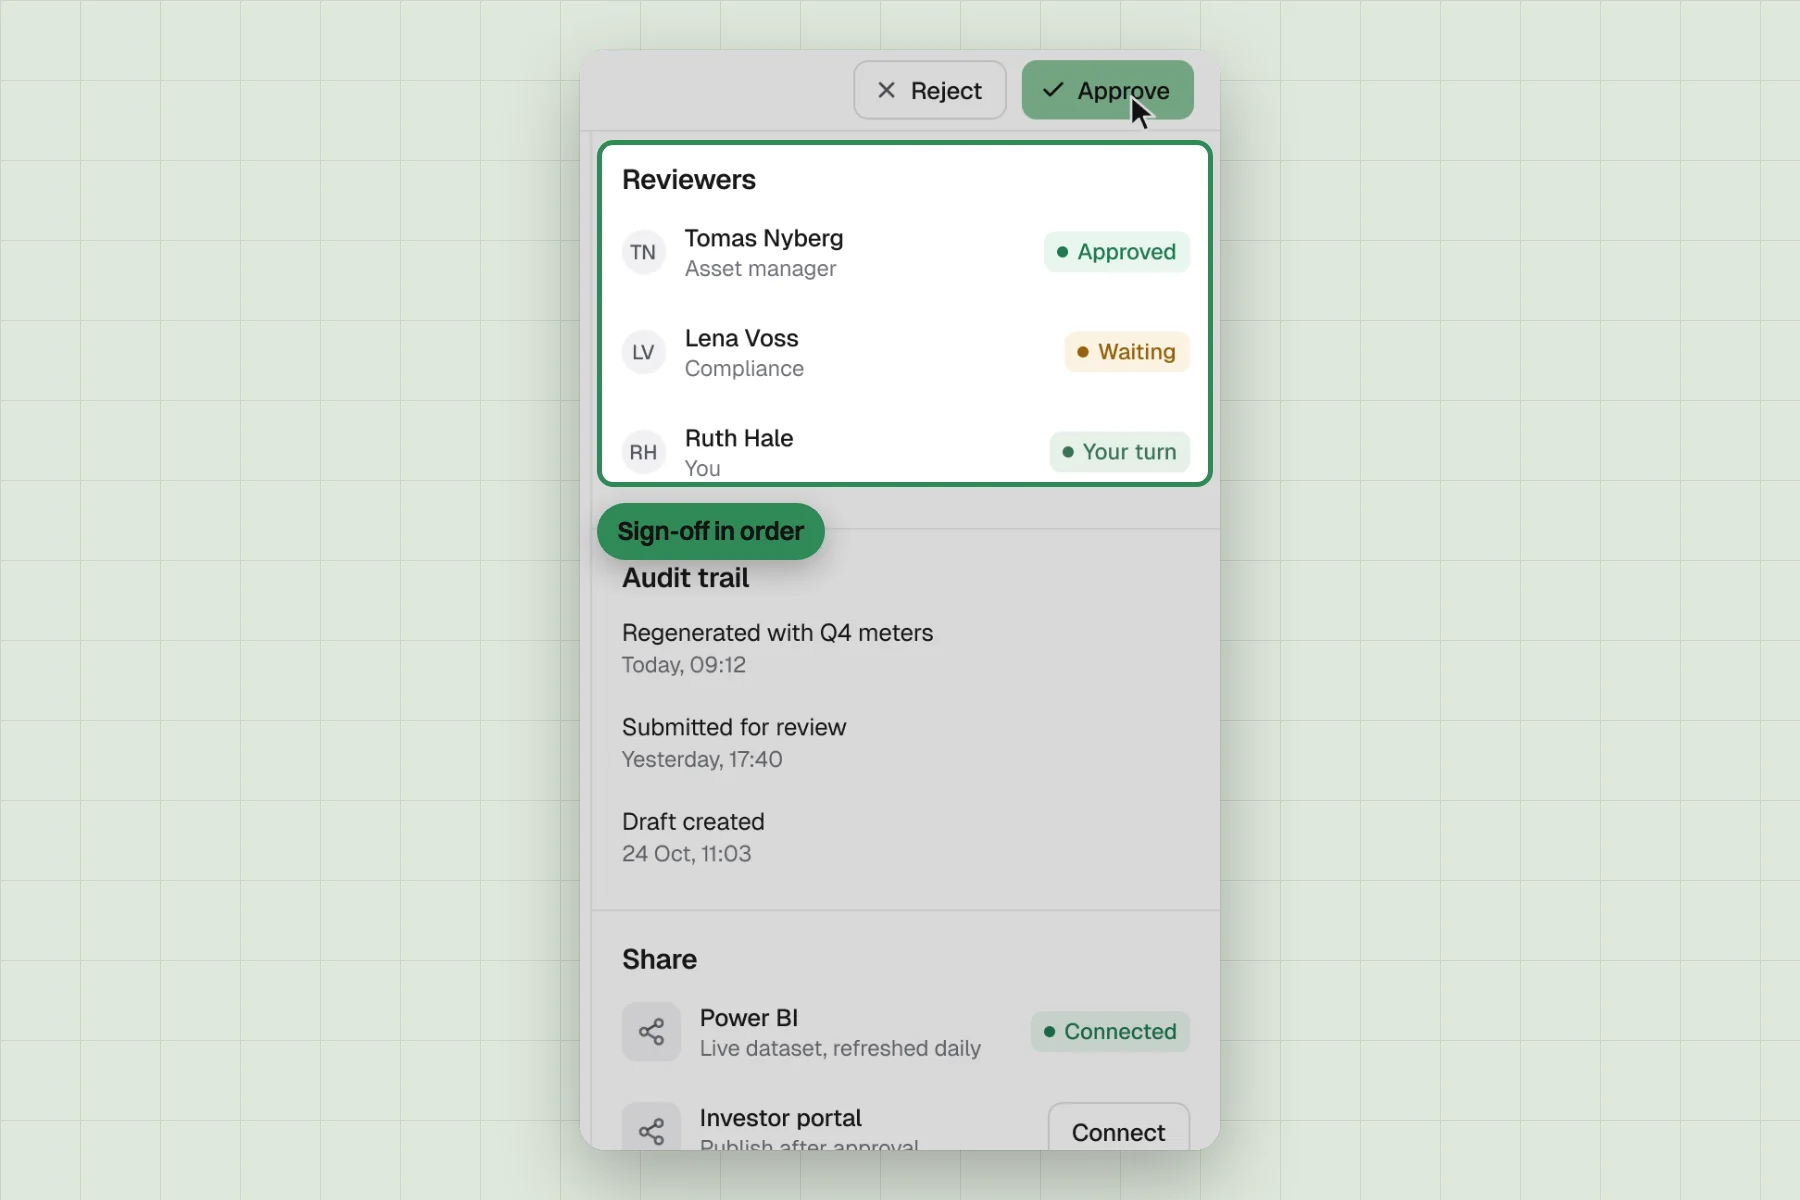
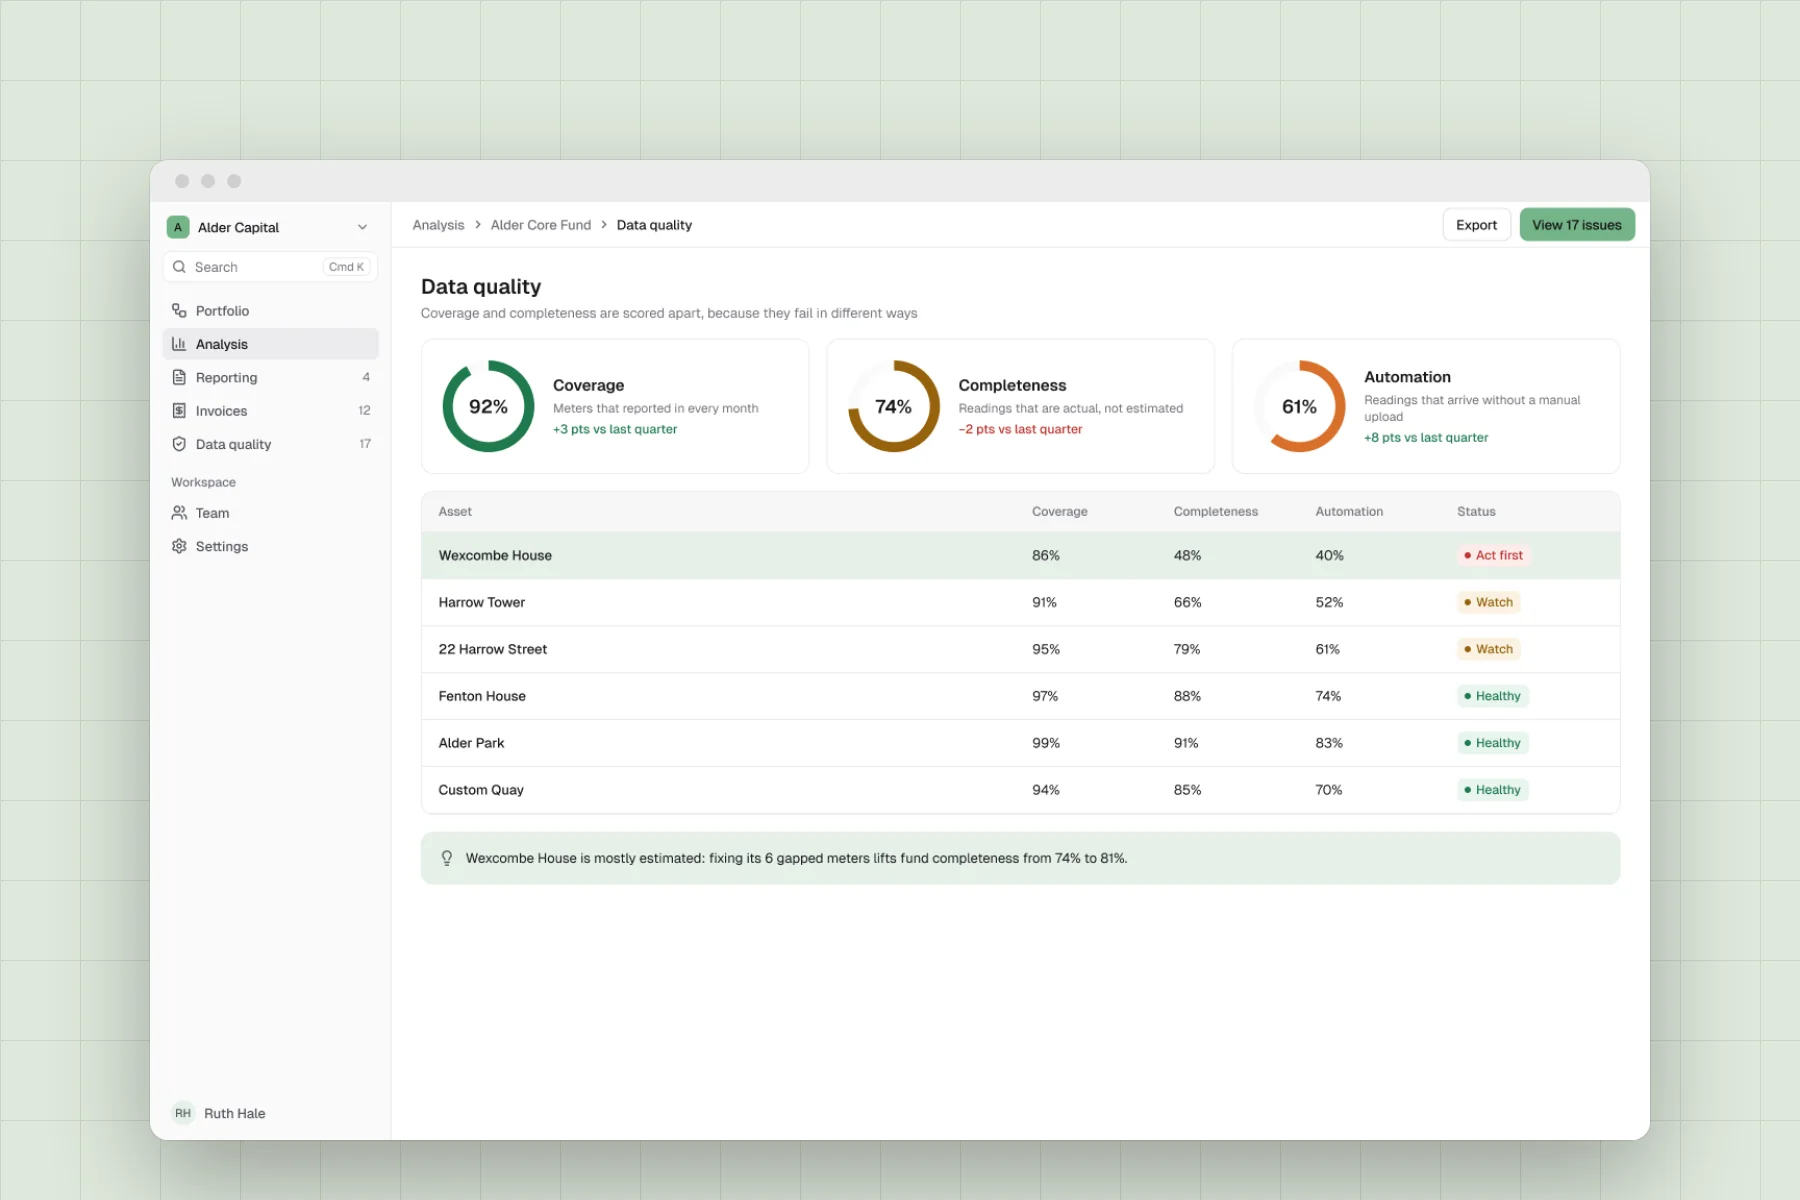
For analytics, that meant drill-downs by scope, sector and asset, and a new data quality module. For reporting, I modelled the workflow before the screens: every report gets a state, a named reviewer and an audit trail.
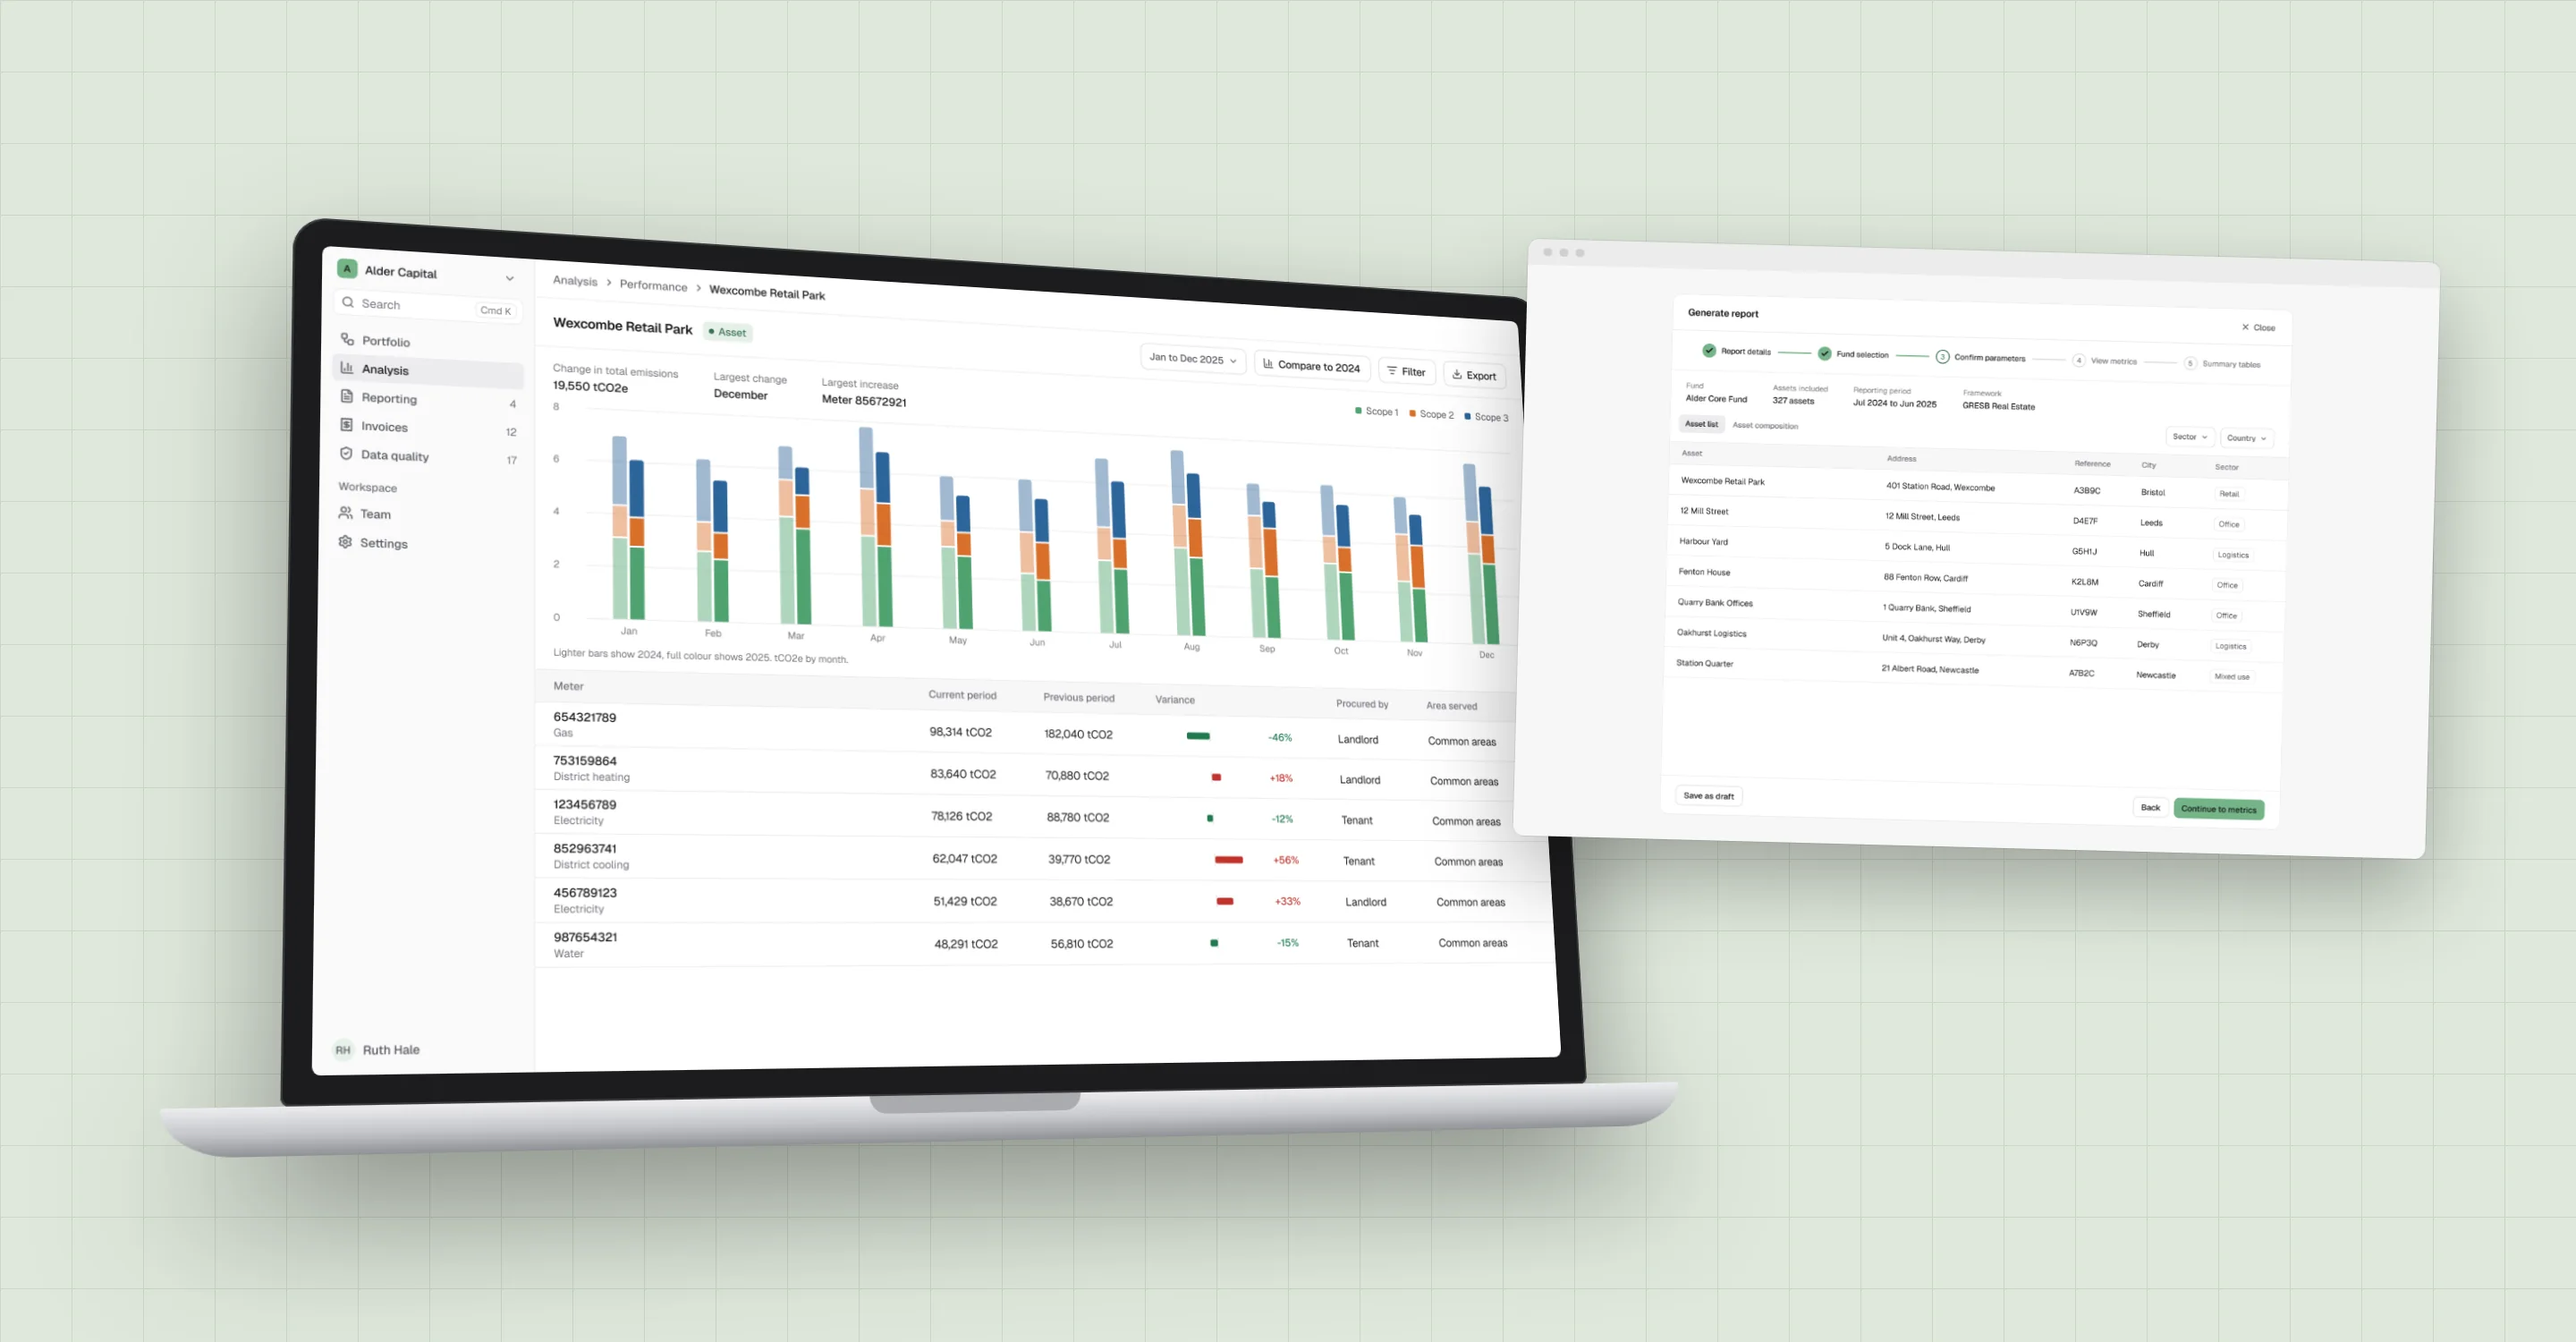
Rebuilt concept for visuals, not the exact shipped interface.
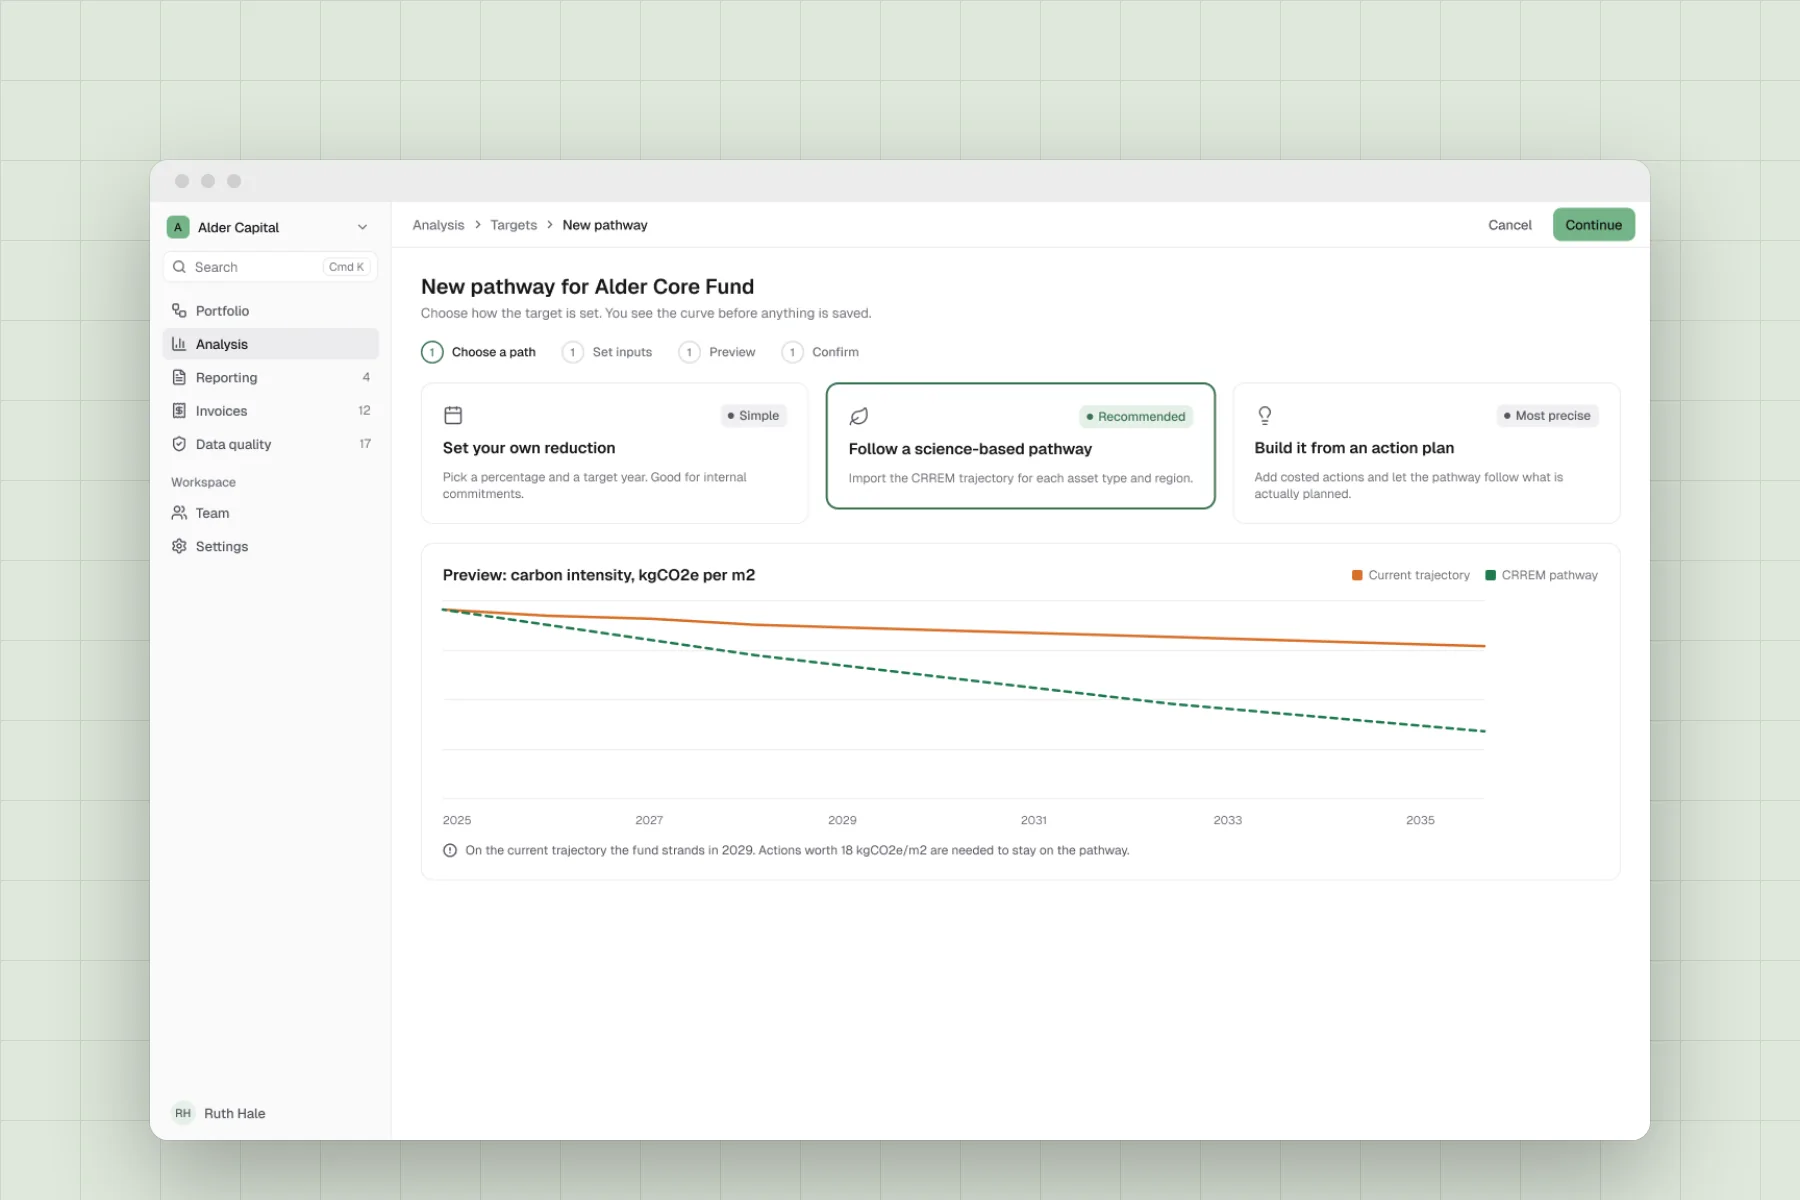
Key decisions
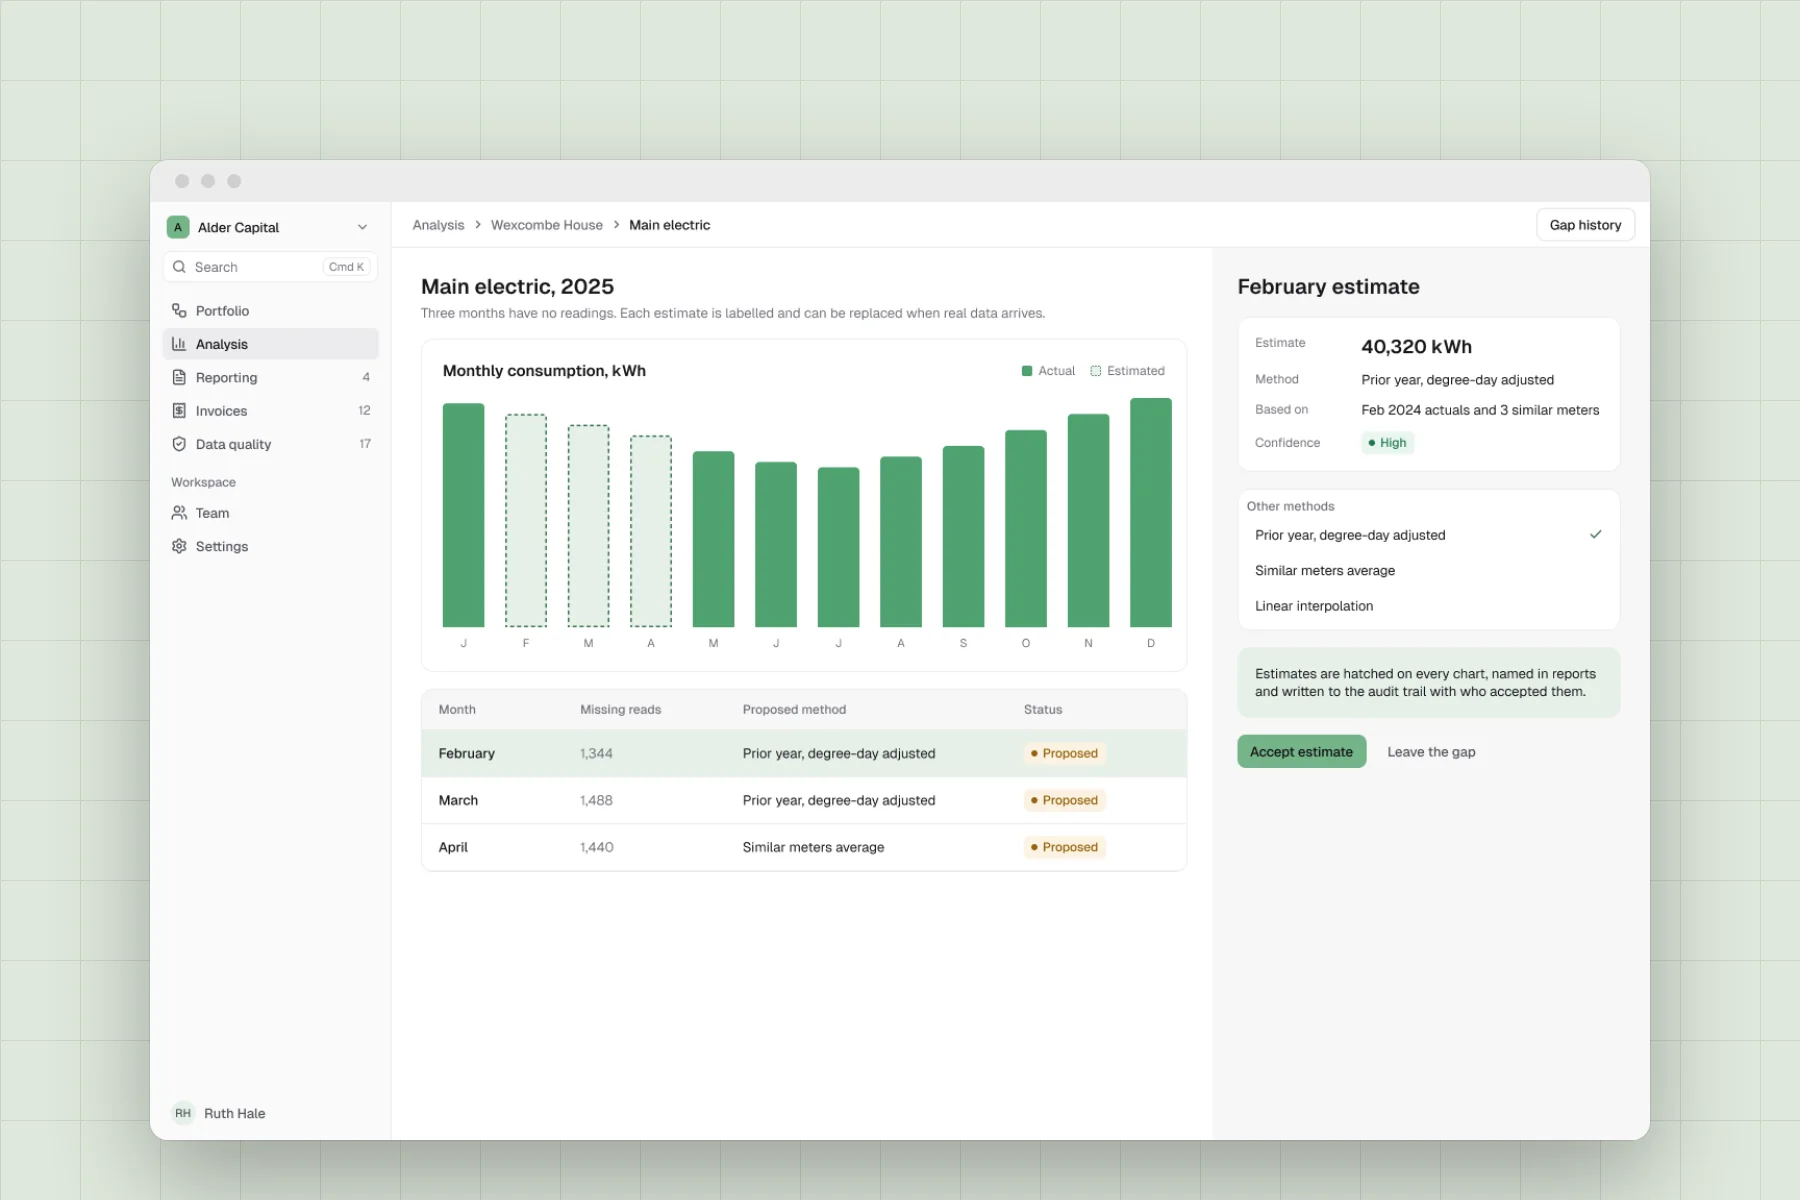
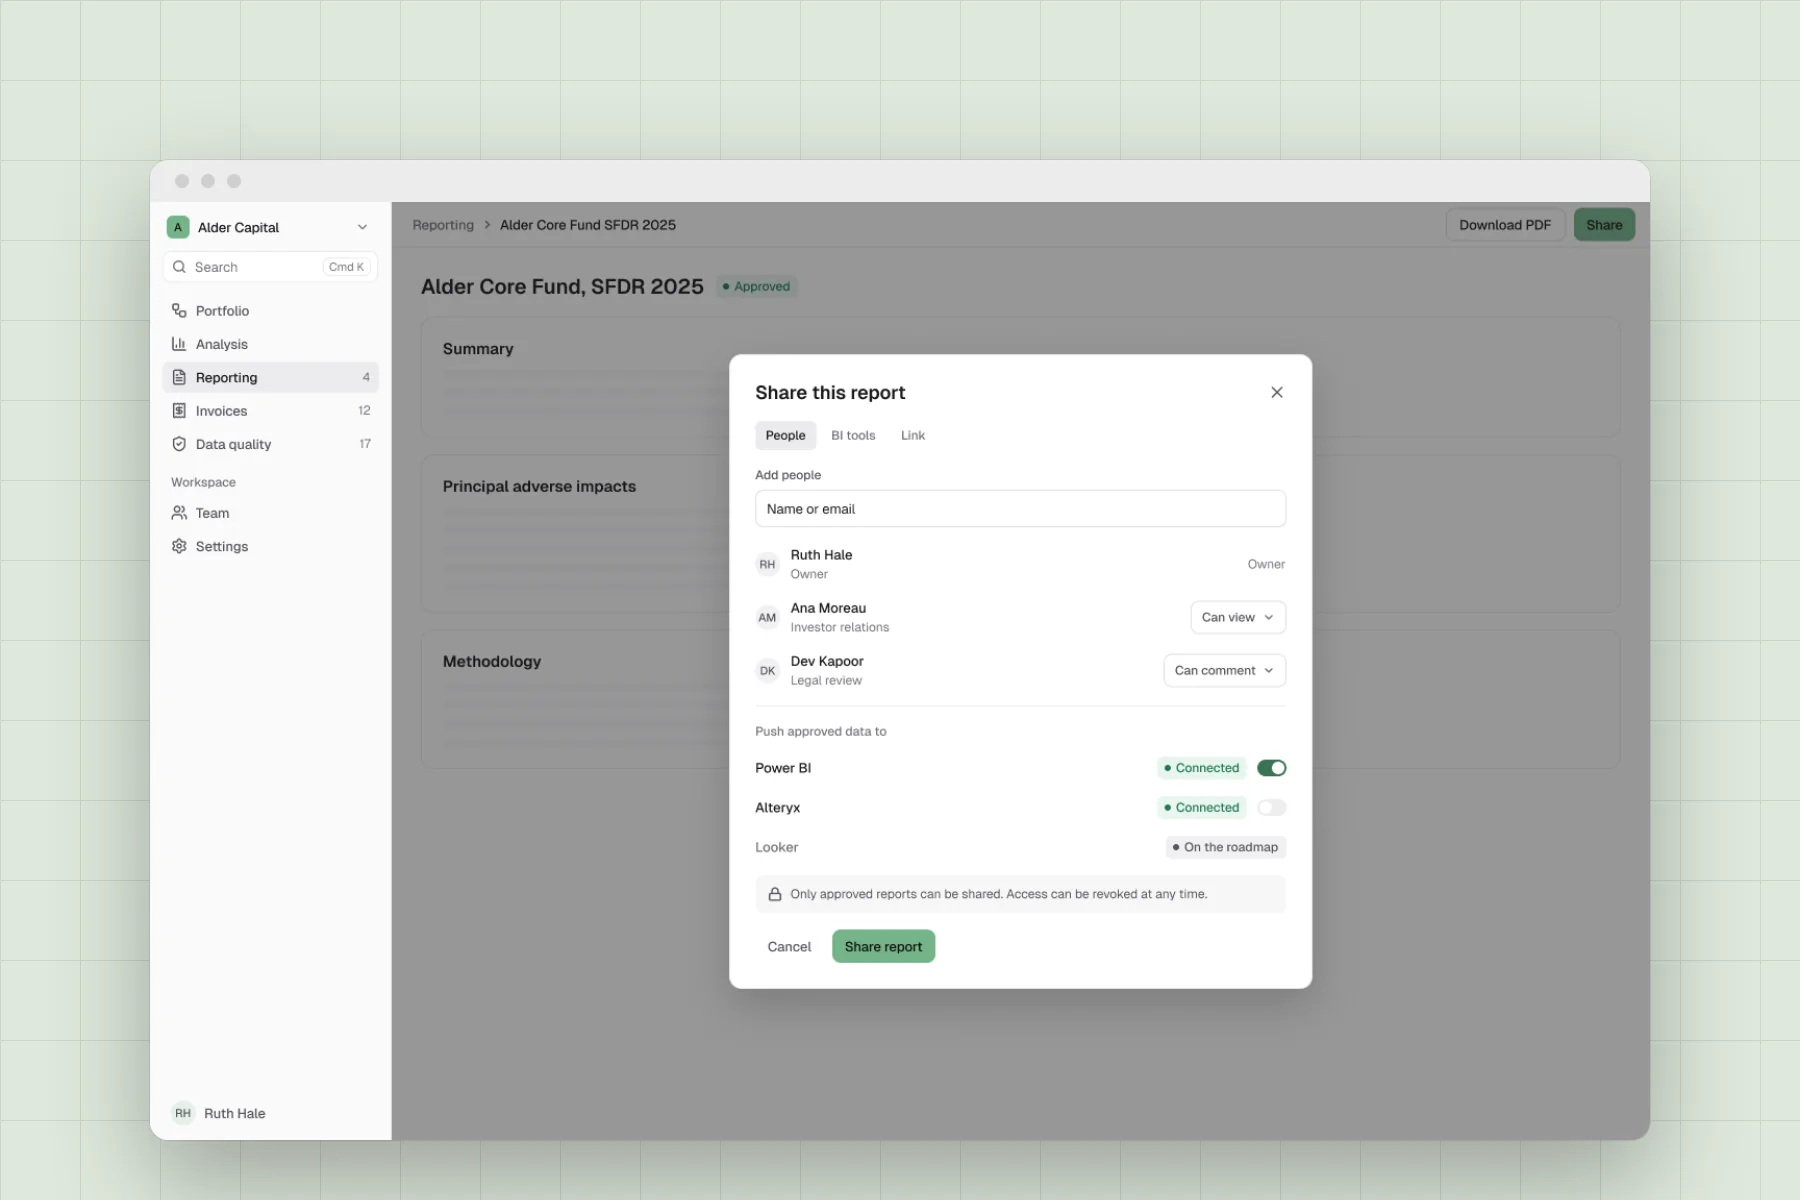
Coverage and completeness are shown apart, because a meter can report every month and still be mostly estimated, and one blended score hid that. Quality sits beside every number, so each figure shows how much of it is actual, estimated or missing. Approval works as a lifecycle, moving from draft to in review to approved or rejected, with a named reviewer at each step. One thing we cut was one-click report generation: the AI writes a draft, a consultant edits it and a senior approves it.
Outcome
Managers could spot a problem, trace it to the meter behind it and see how far to trust the figure, without leaving the platform. Reports became tracked items with a state, a named reviewer and a visible history. Approved reports could be shared as a PDF, a revocable link or straight into Power BI.
The platform moved from storing data to answering questions about it, and reporting moved out of email threads and into the product.