Restructuring Data Model
Evora Global
Context
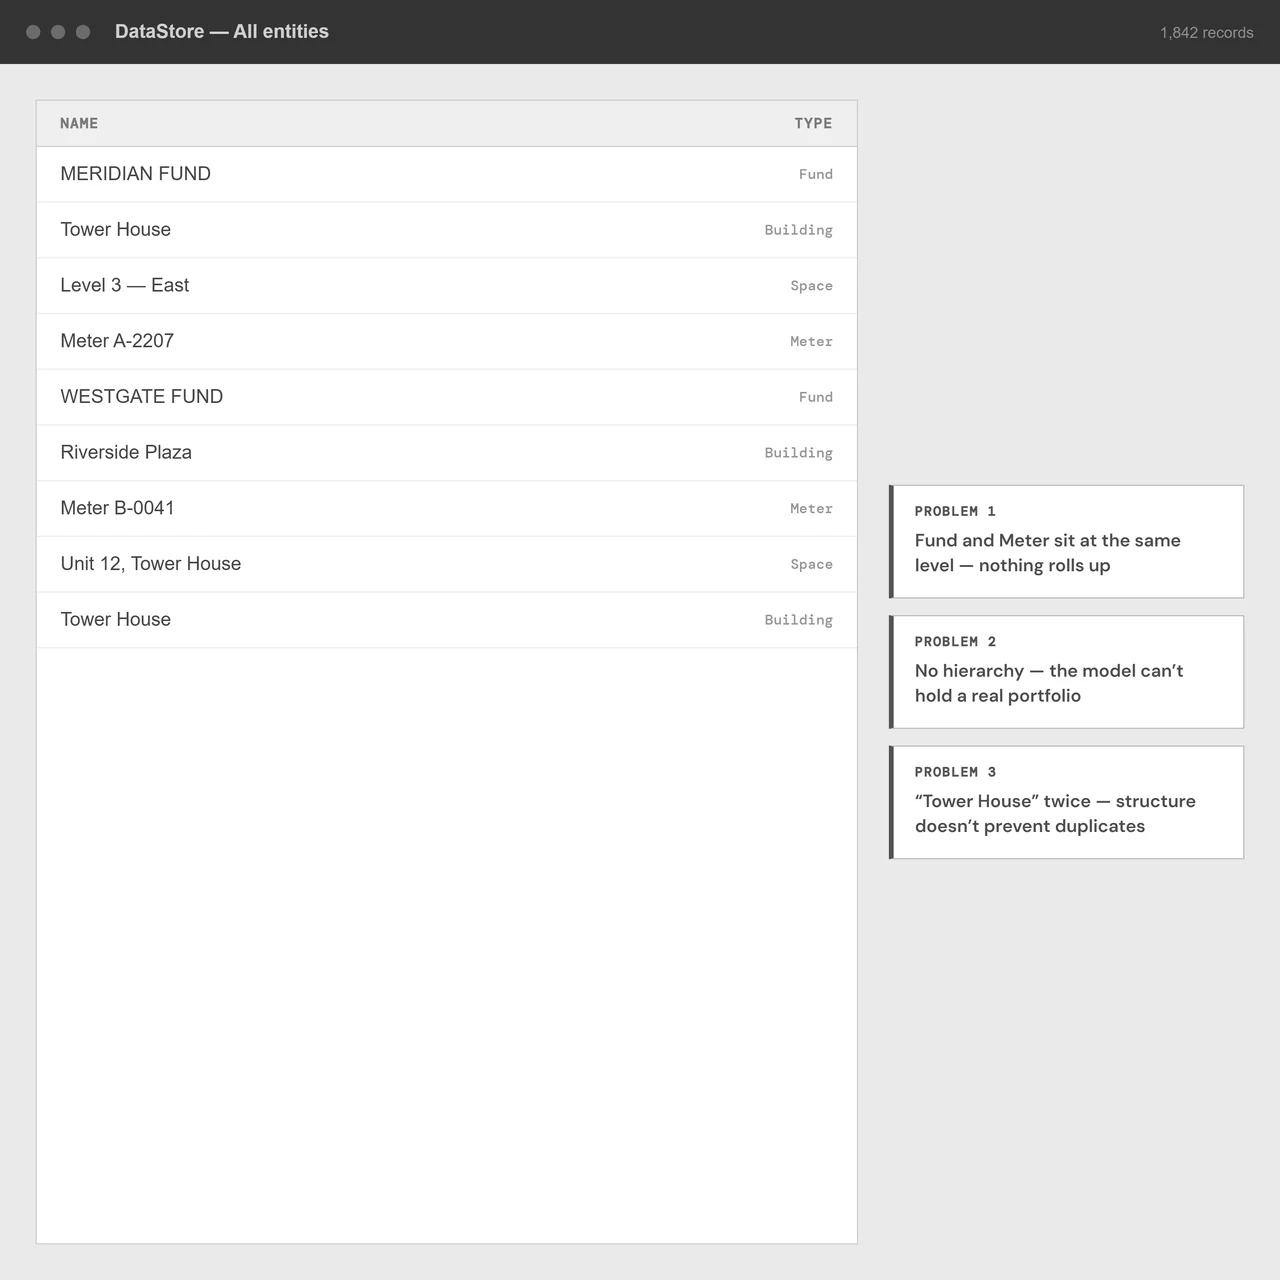
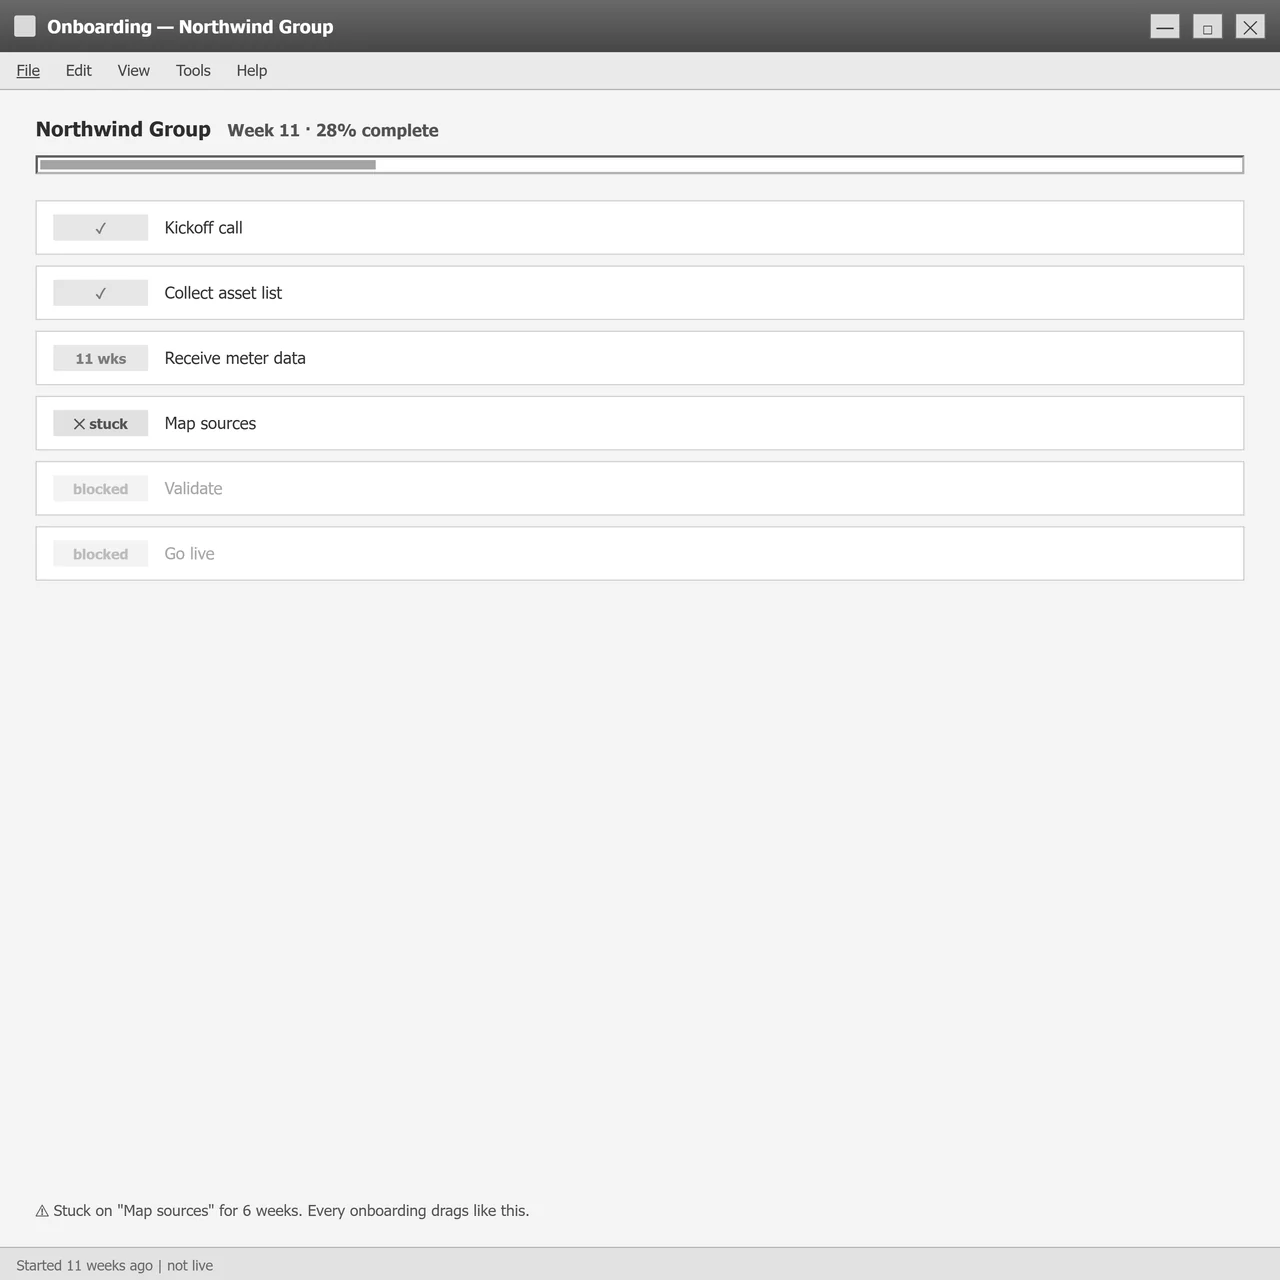
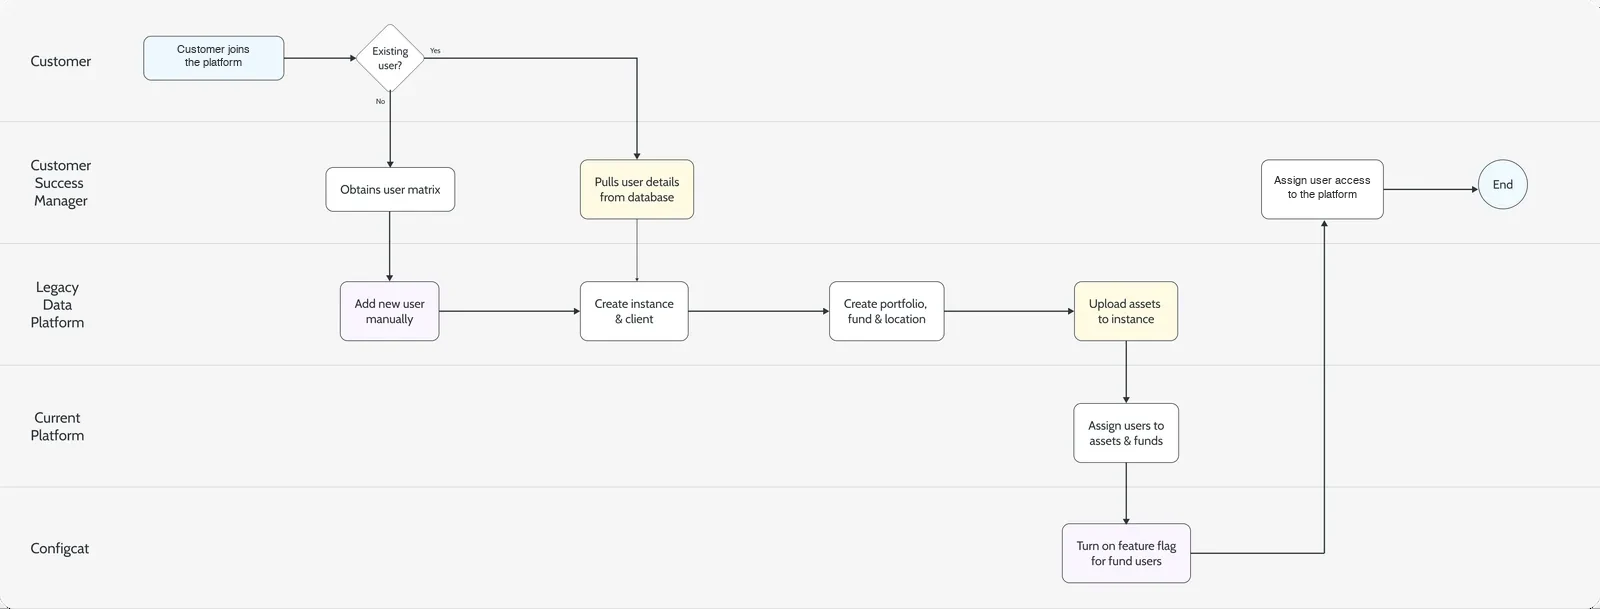
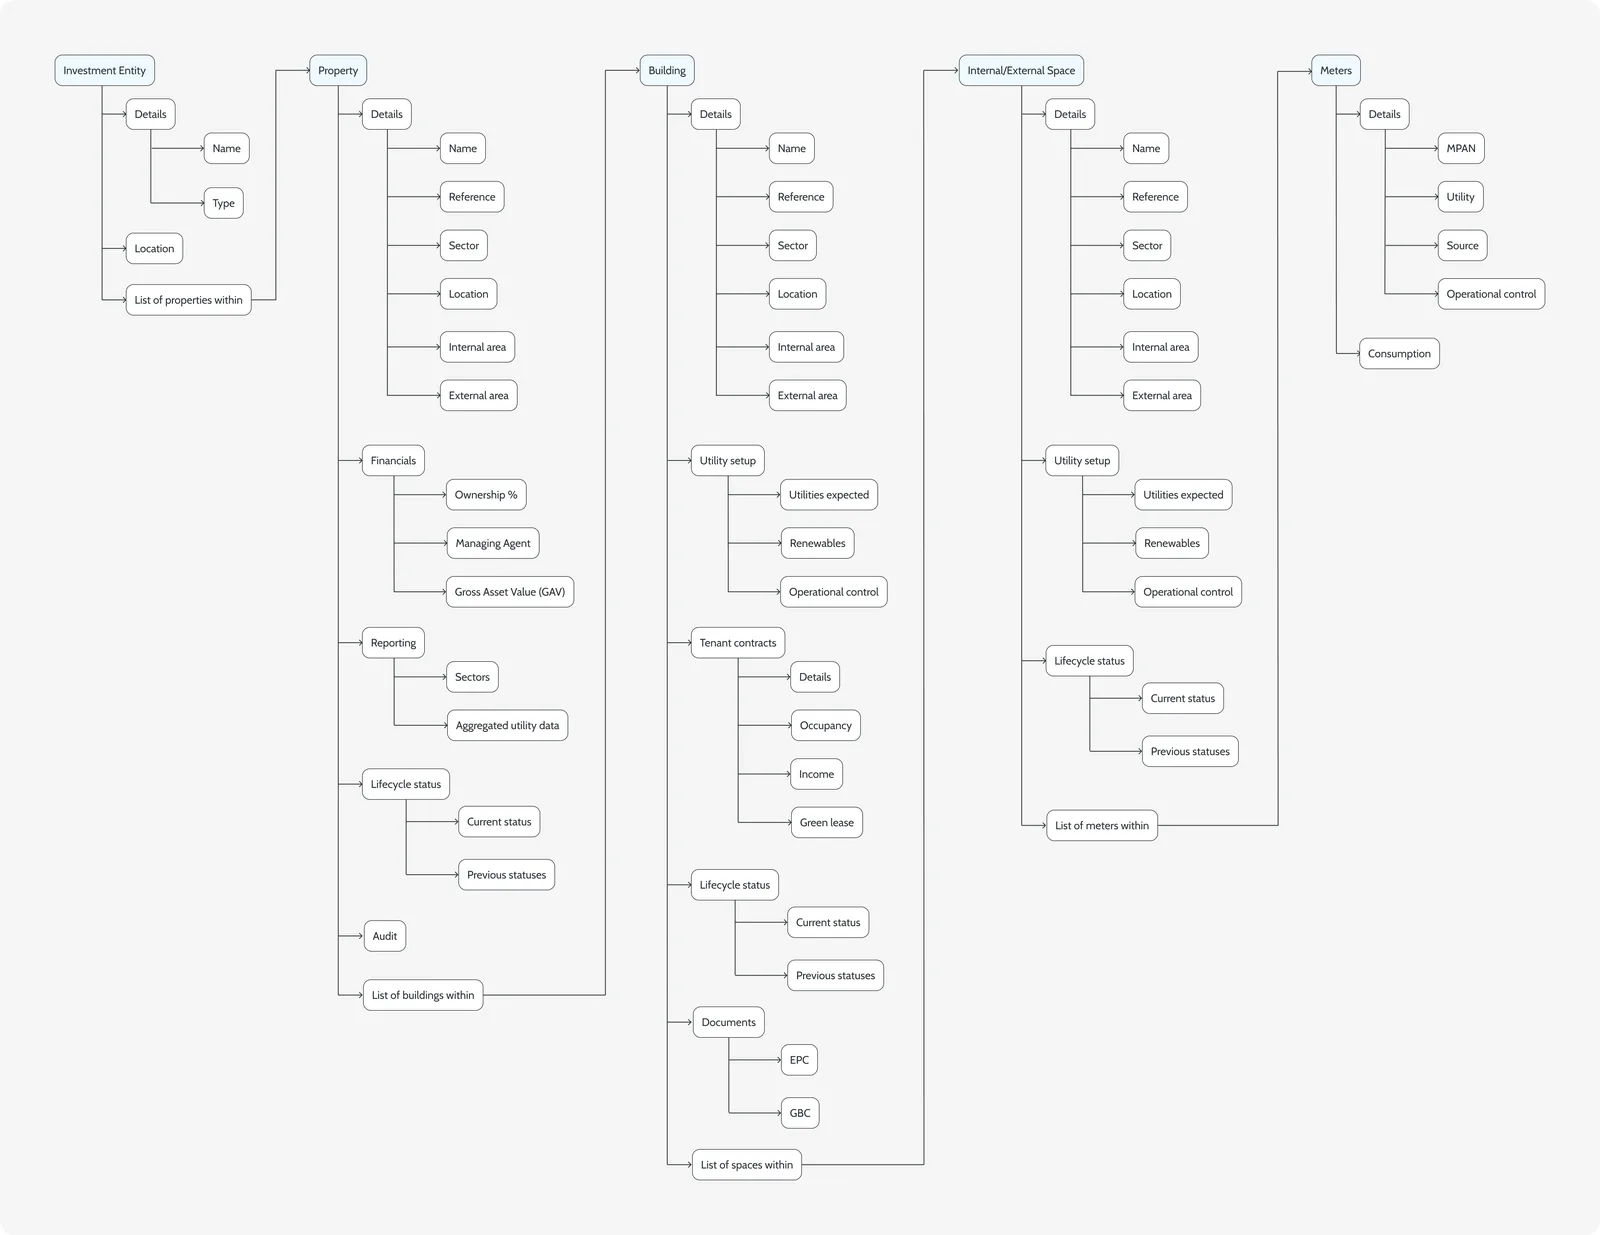
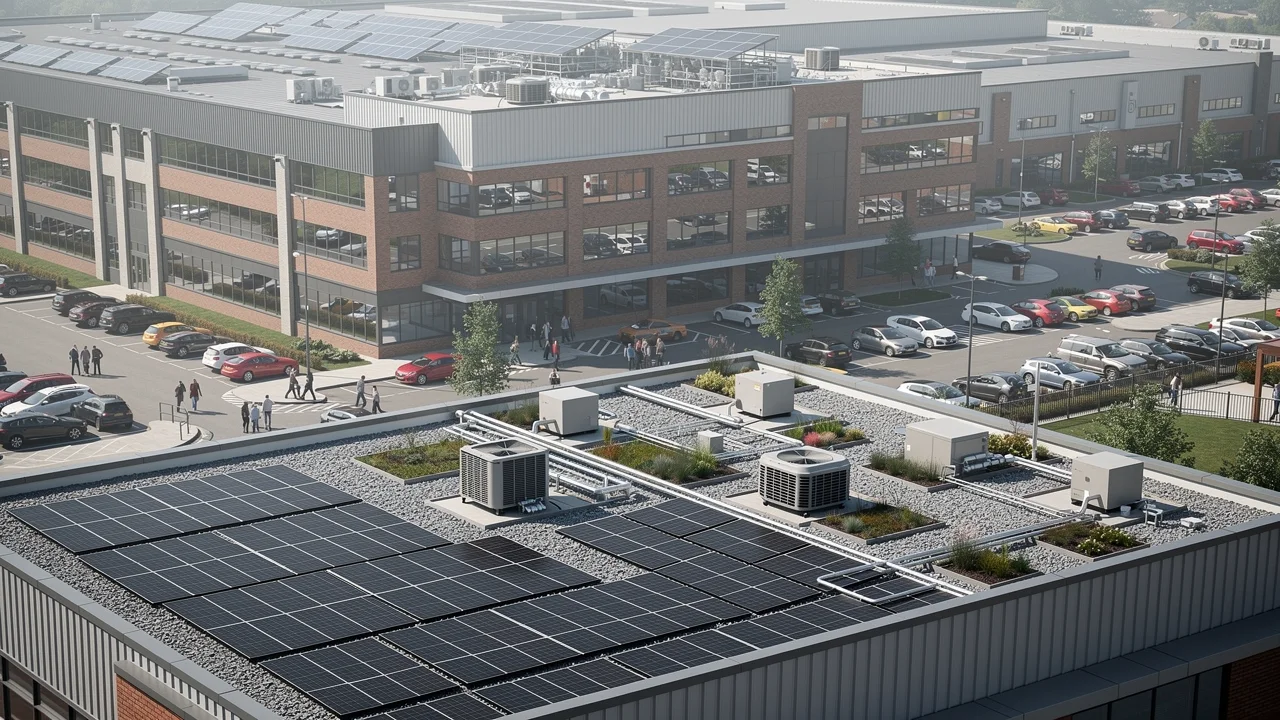
The platform got portfolios wrong. Funds, properties, buildings, spaces and meters sat in one flat list with implicit relationships, and onboarding captured them in the wrong order. Every screen inherited the same blind spots, and customers kept parallel spreadsheets because they did not trust the product. No interface patch could fix it: the model itself had to change.
Approach
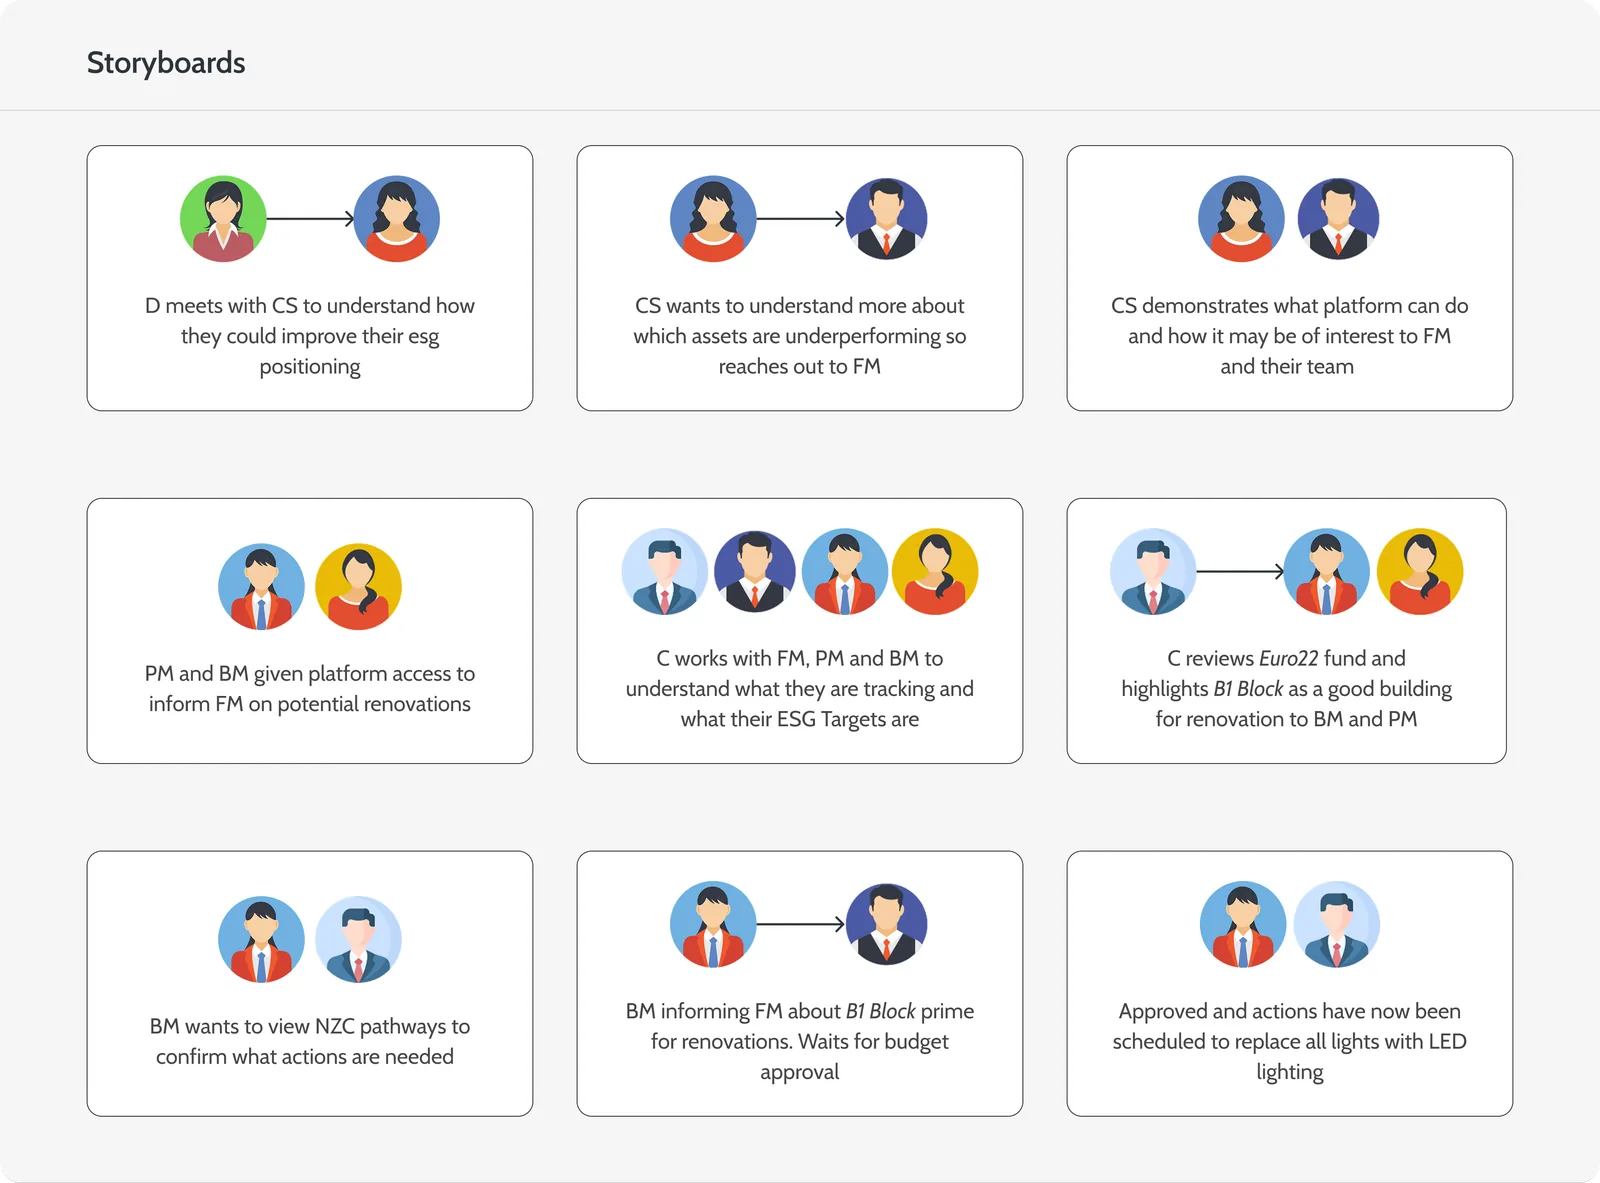
I led the design work with two UX researchers, a product manager, four engineers and two data architects. We rebuilt the entity hierarchy first, then the onboarding that fills it, then the interface on top.
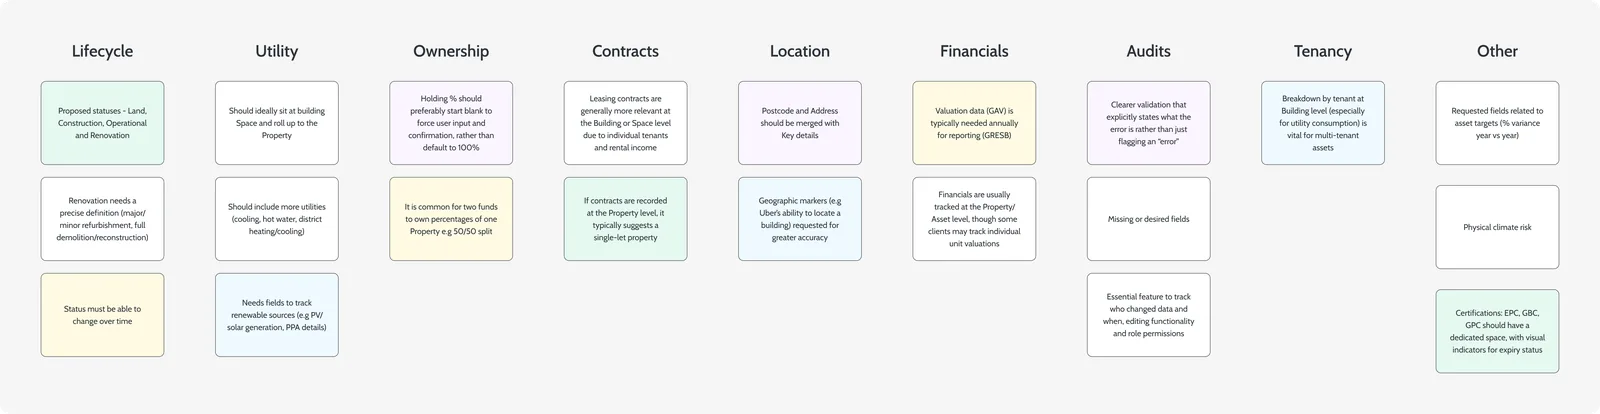
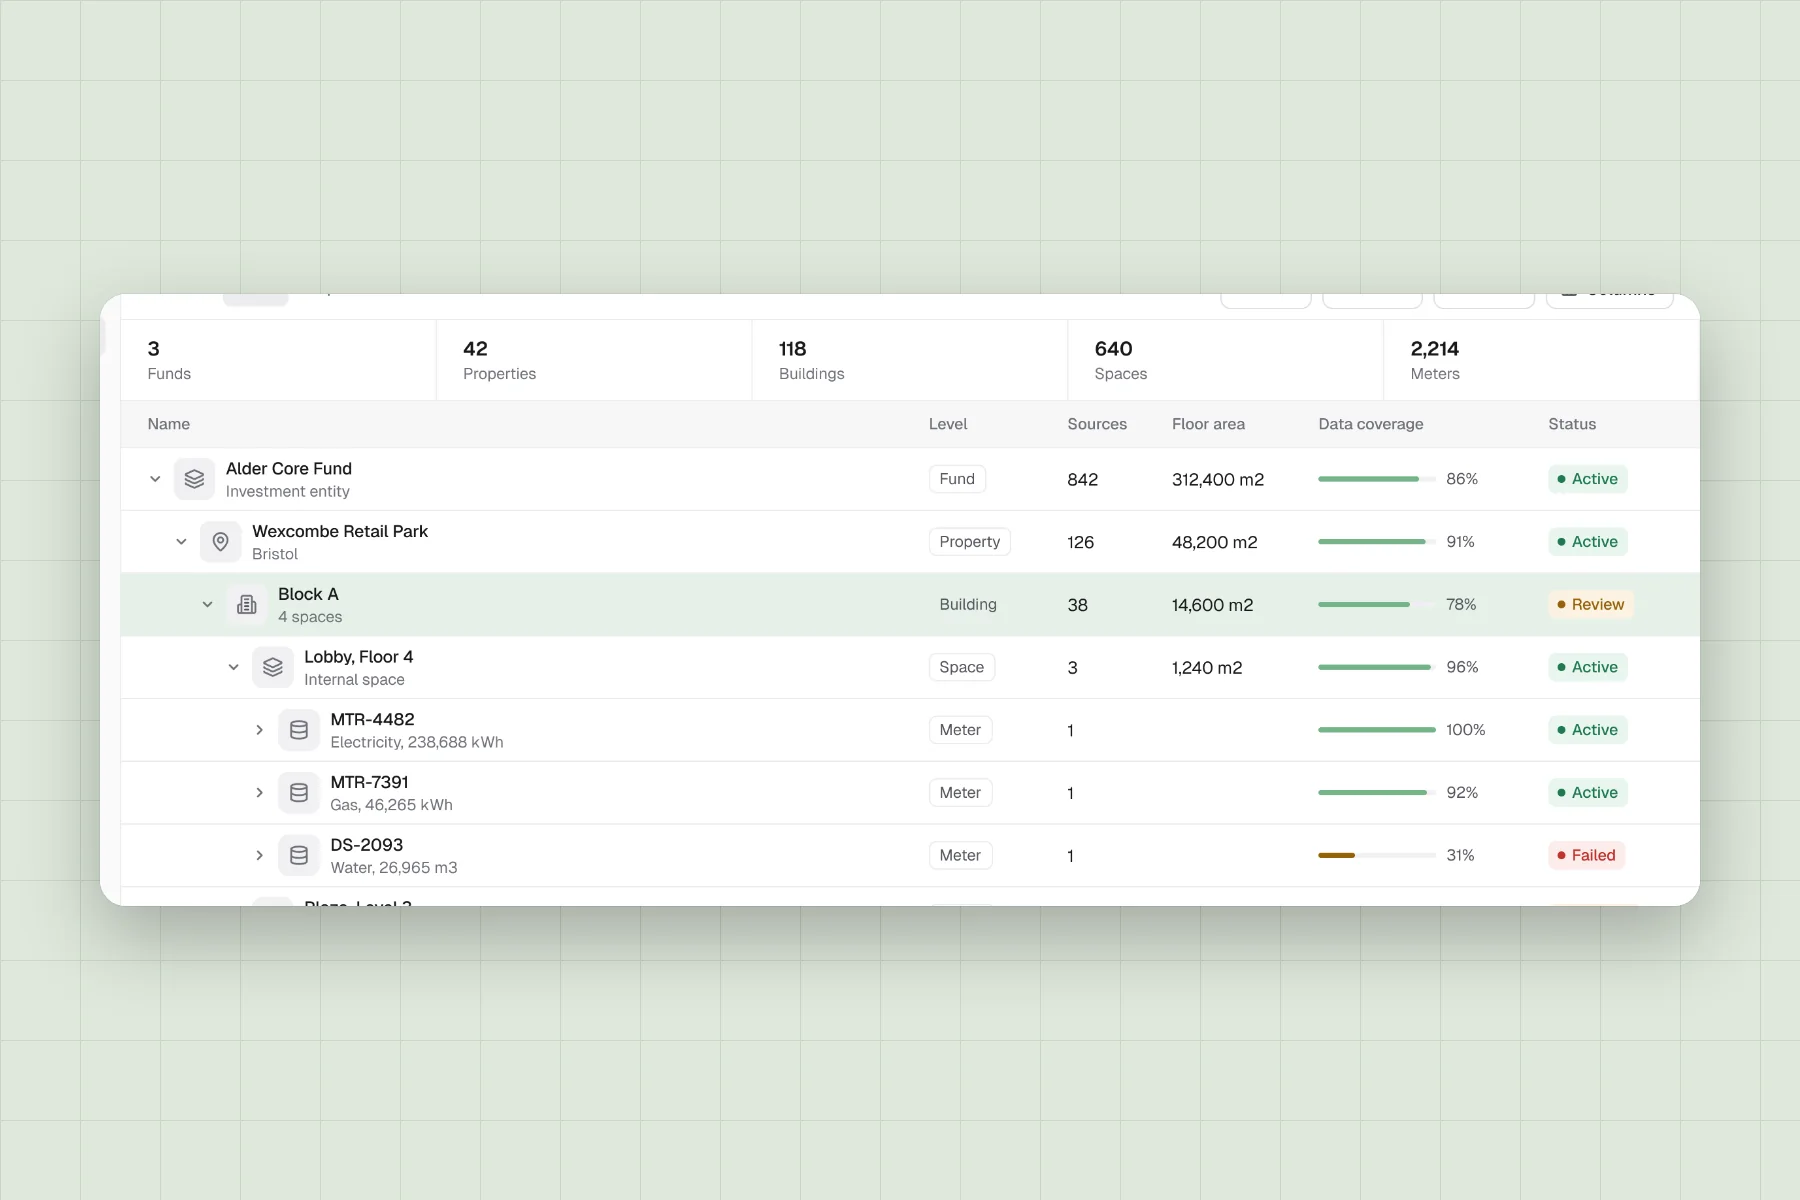
Research with consultants, asset managers and customers showed the same symptom across three roles: the model did not match how they thought about their portfolio. Card sorting and prototype tests on real portfolio shapes took us from three levels to five, adding Space between Building and Meter, with totals rolling up instead of being typed in.
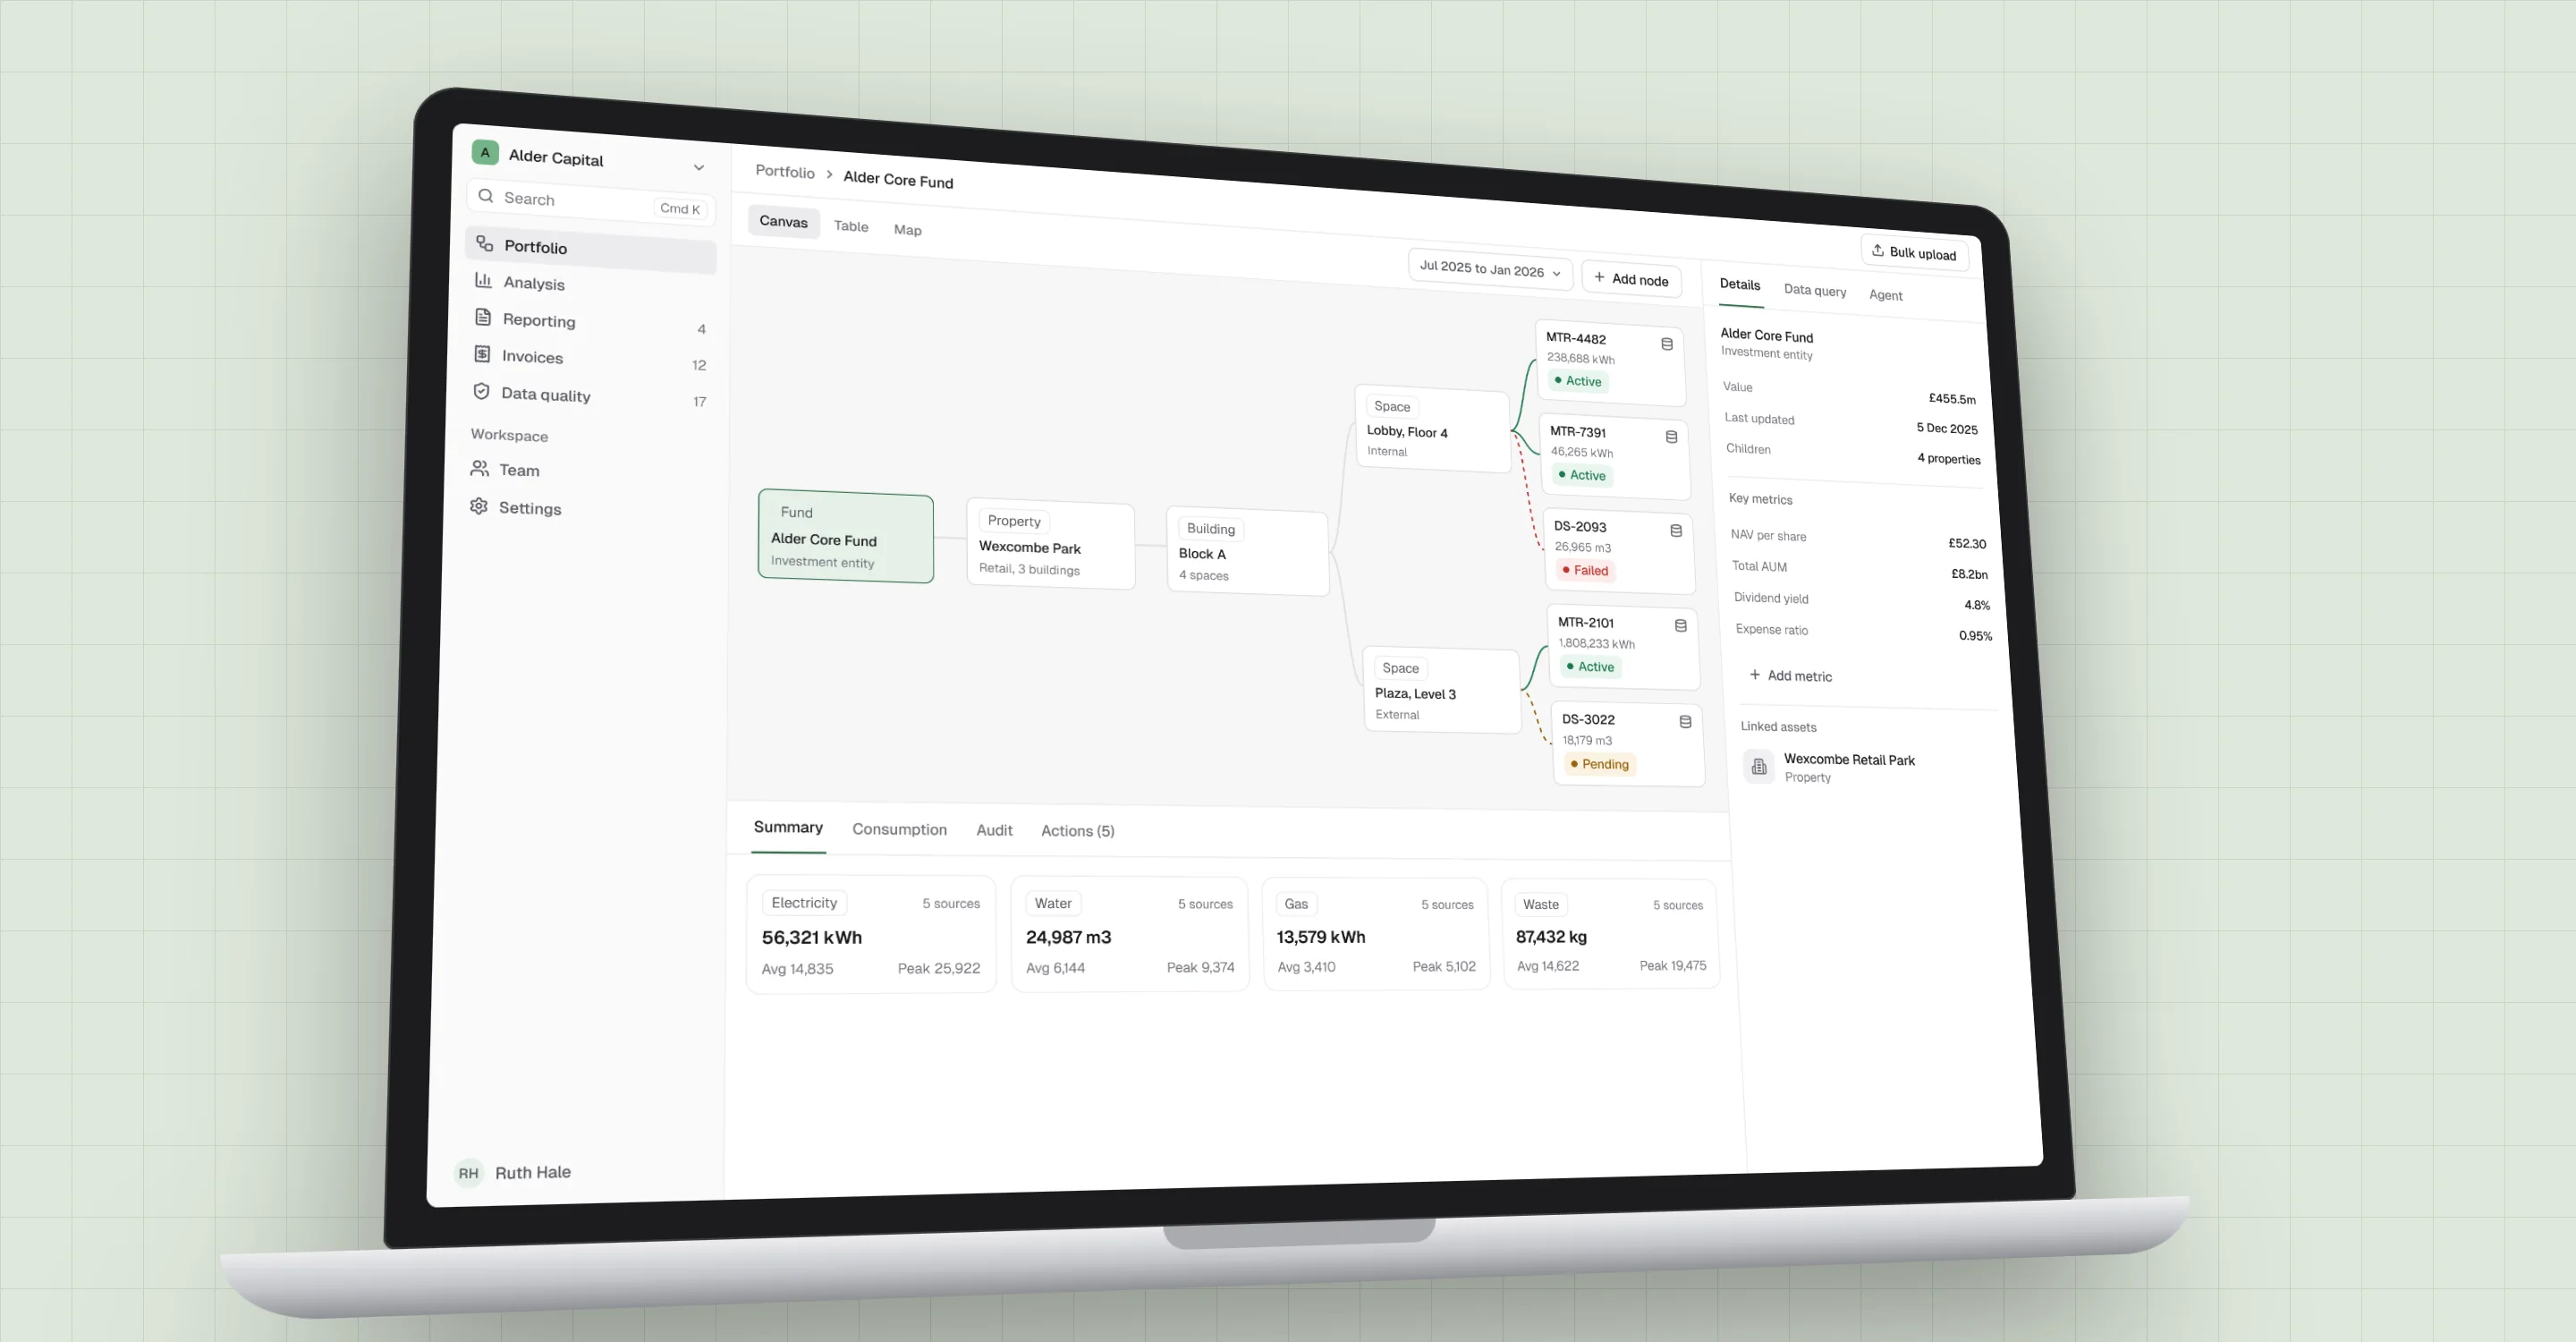
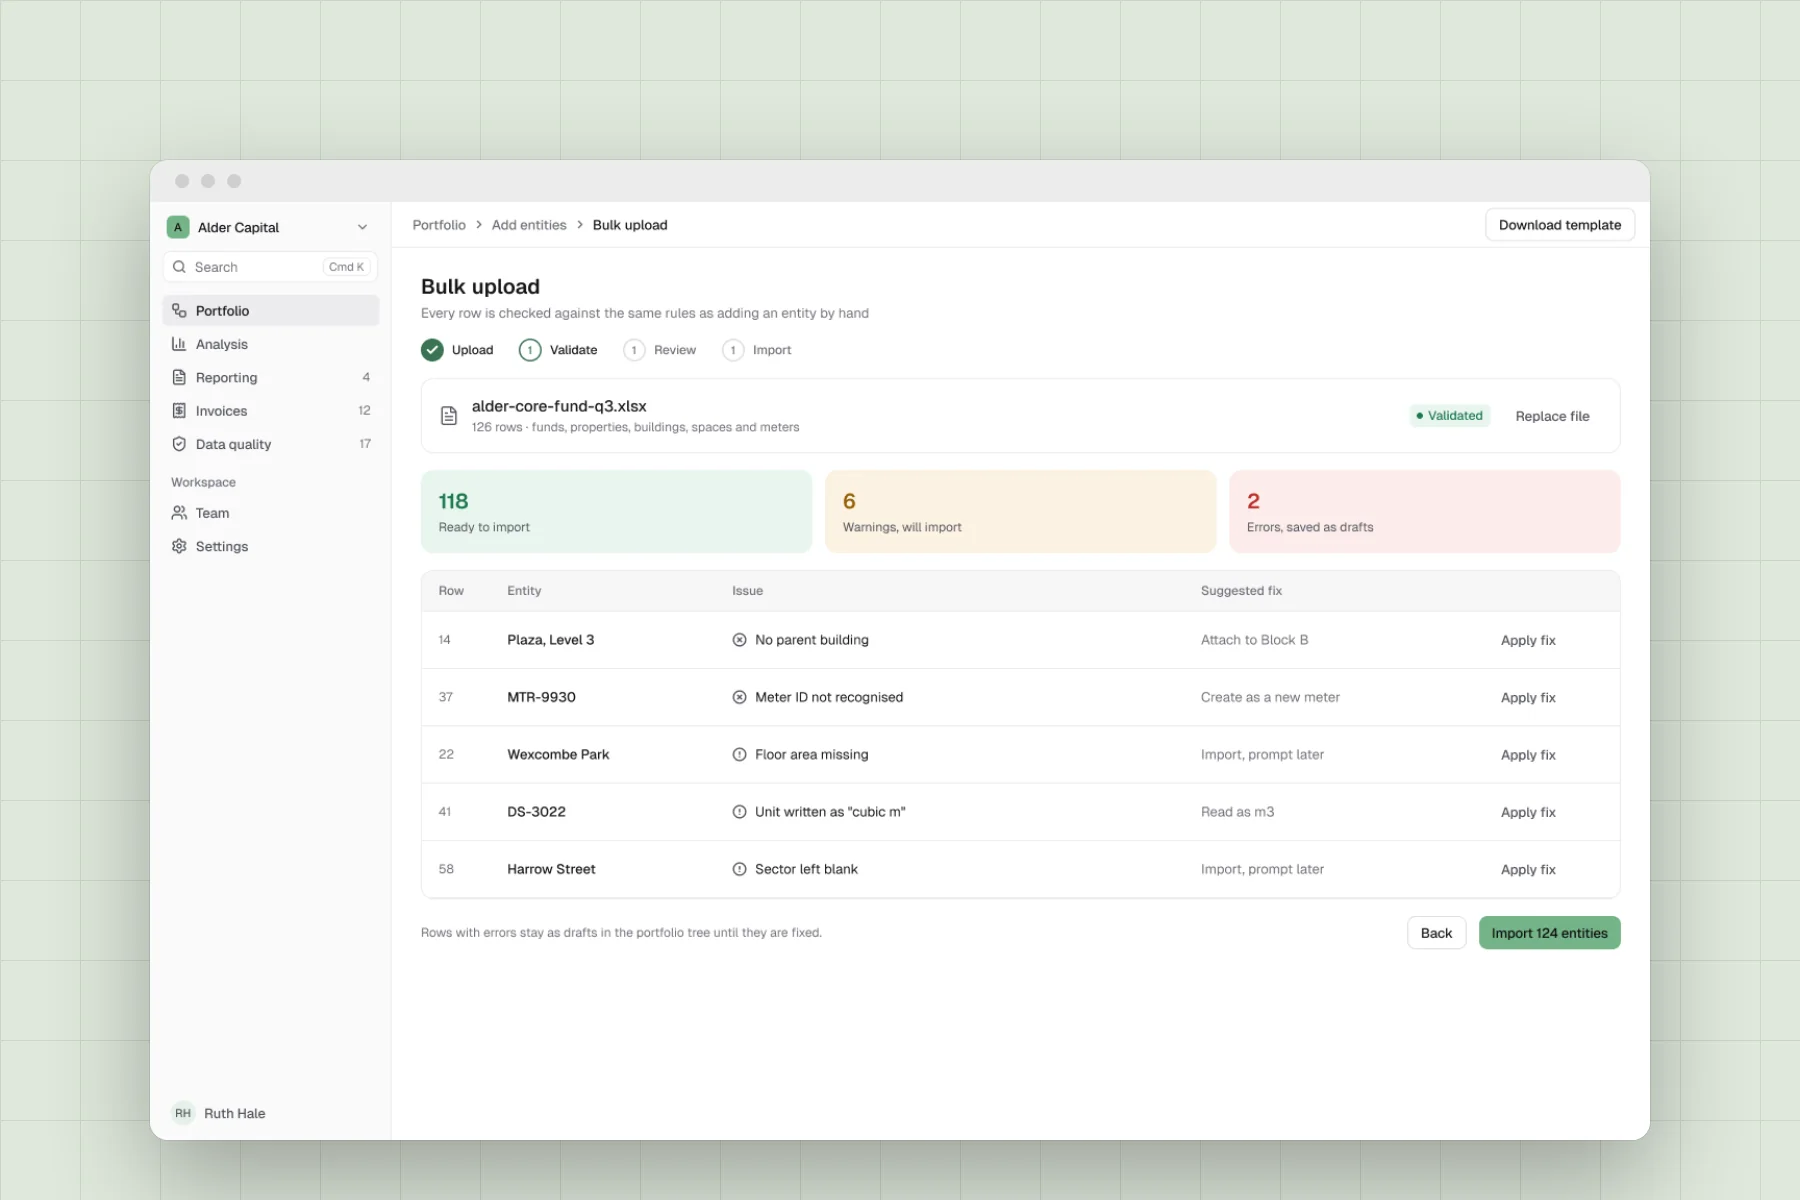
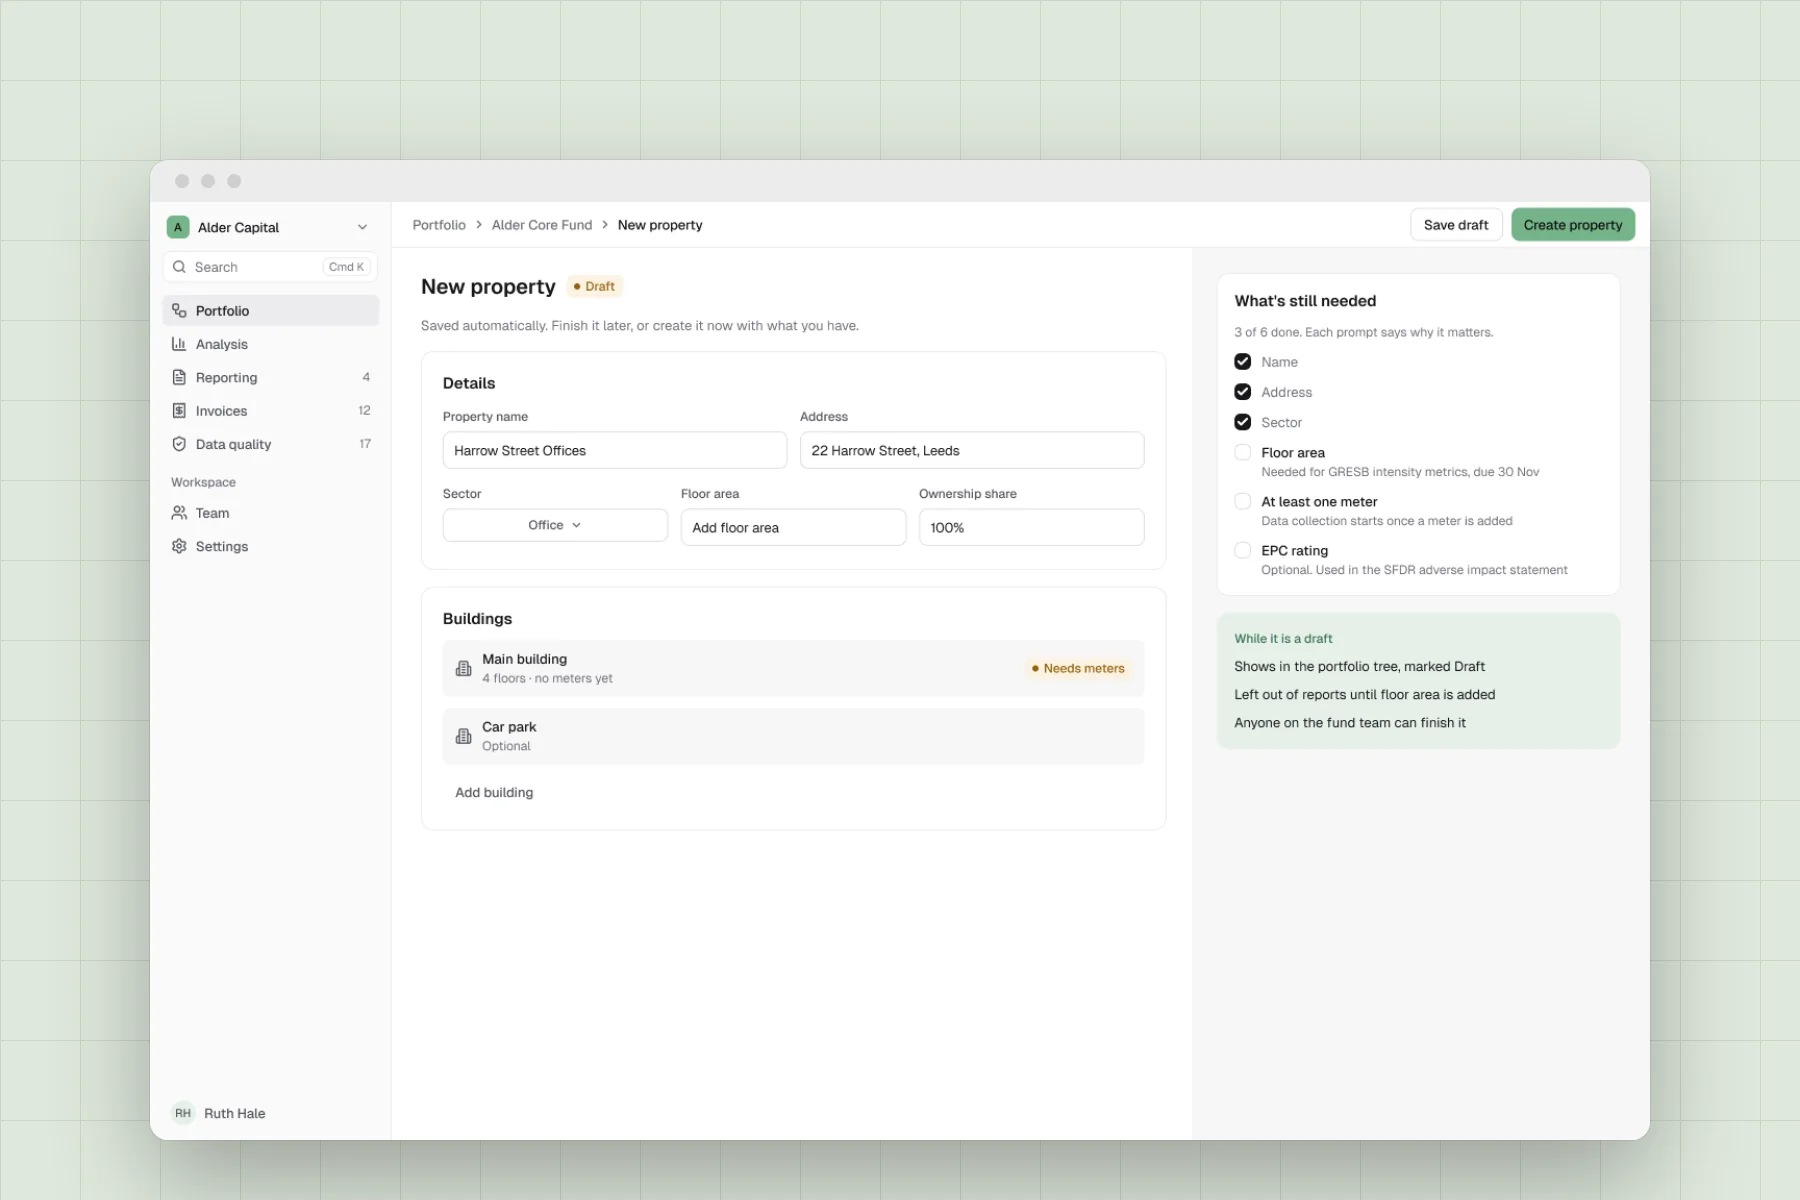
Rebuilt concept for visuals, not the exact shipped interface.
Key decisions
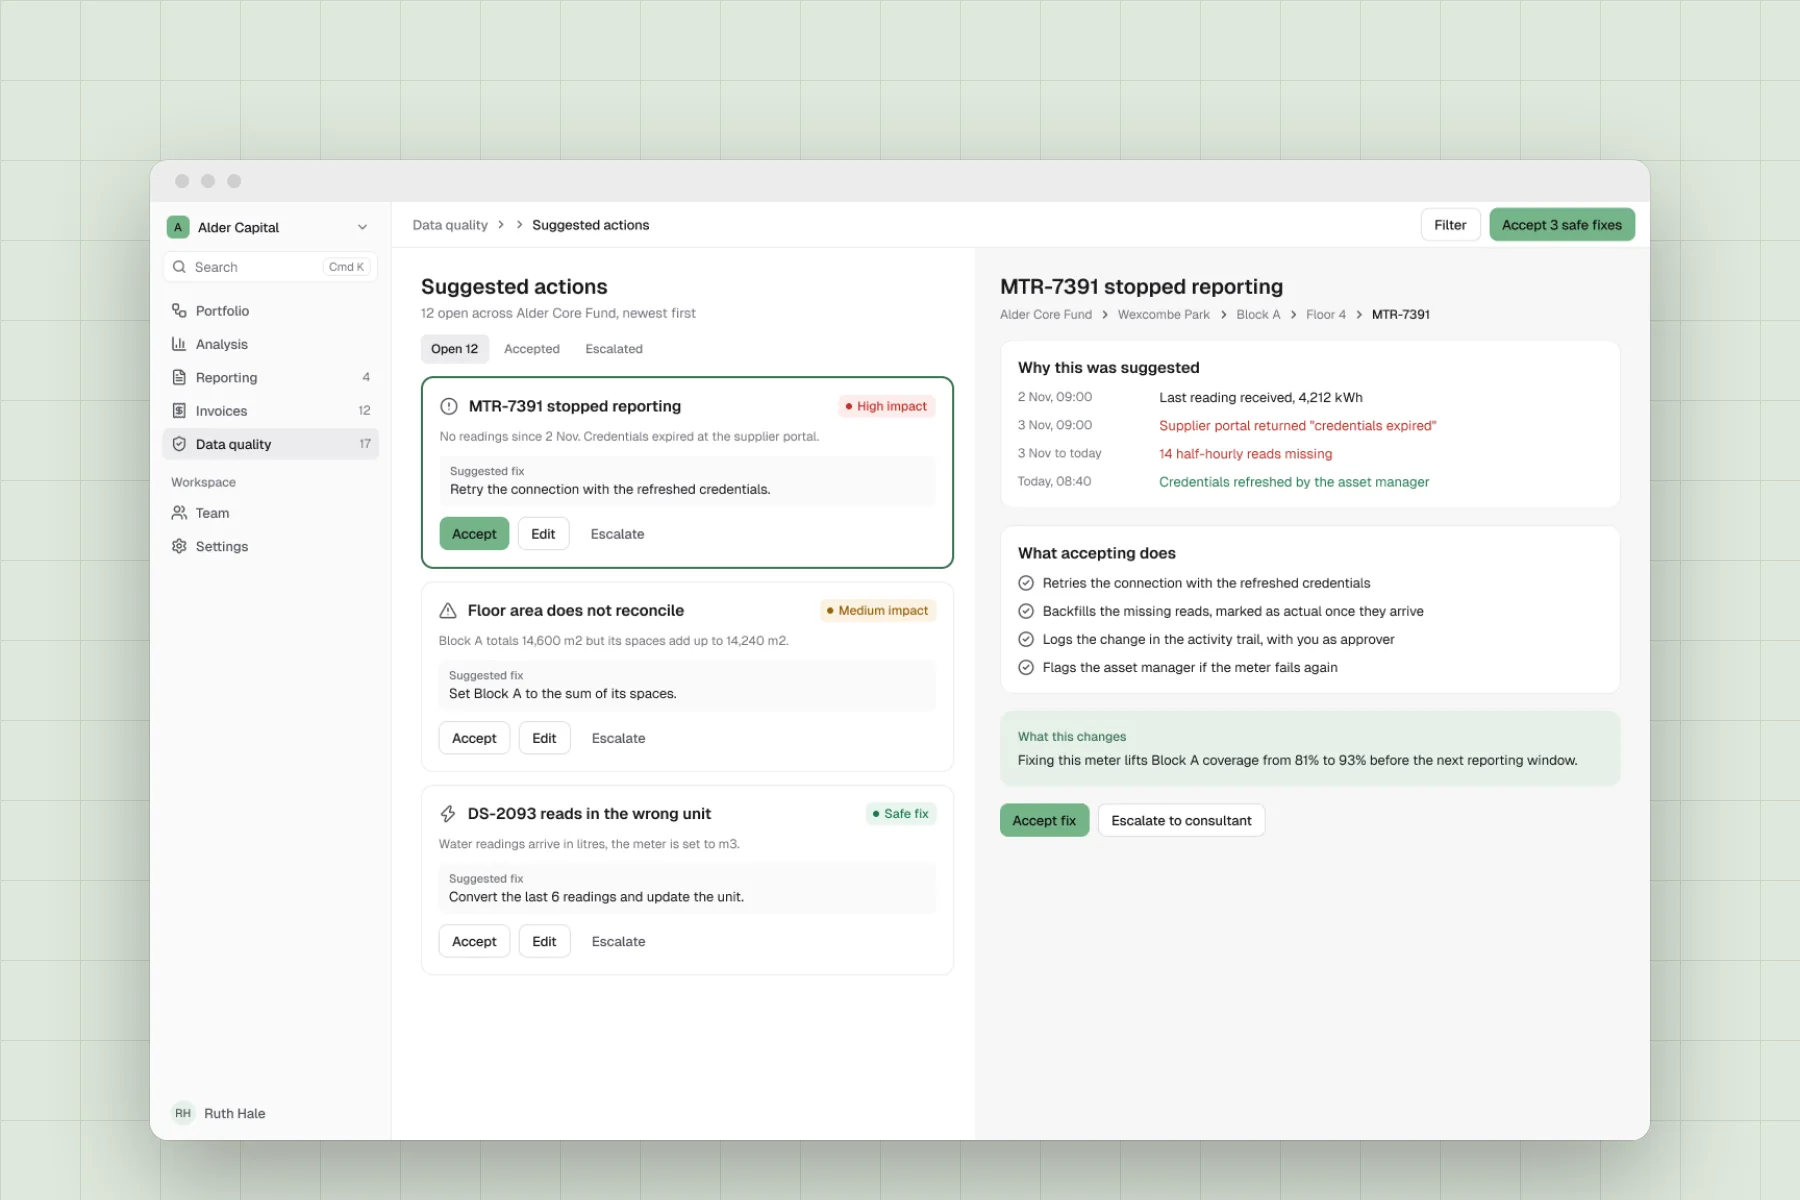
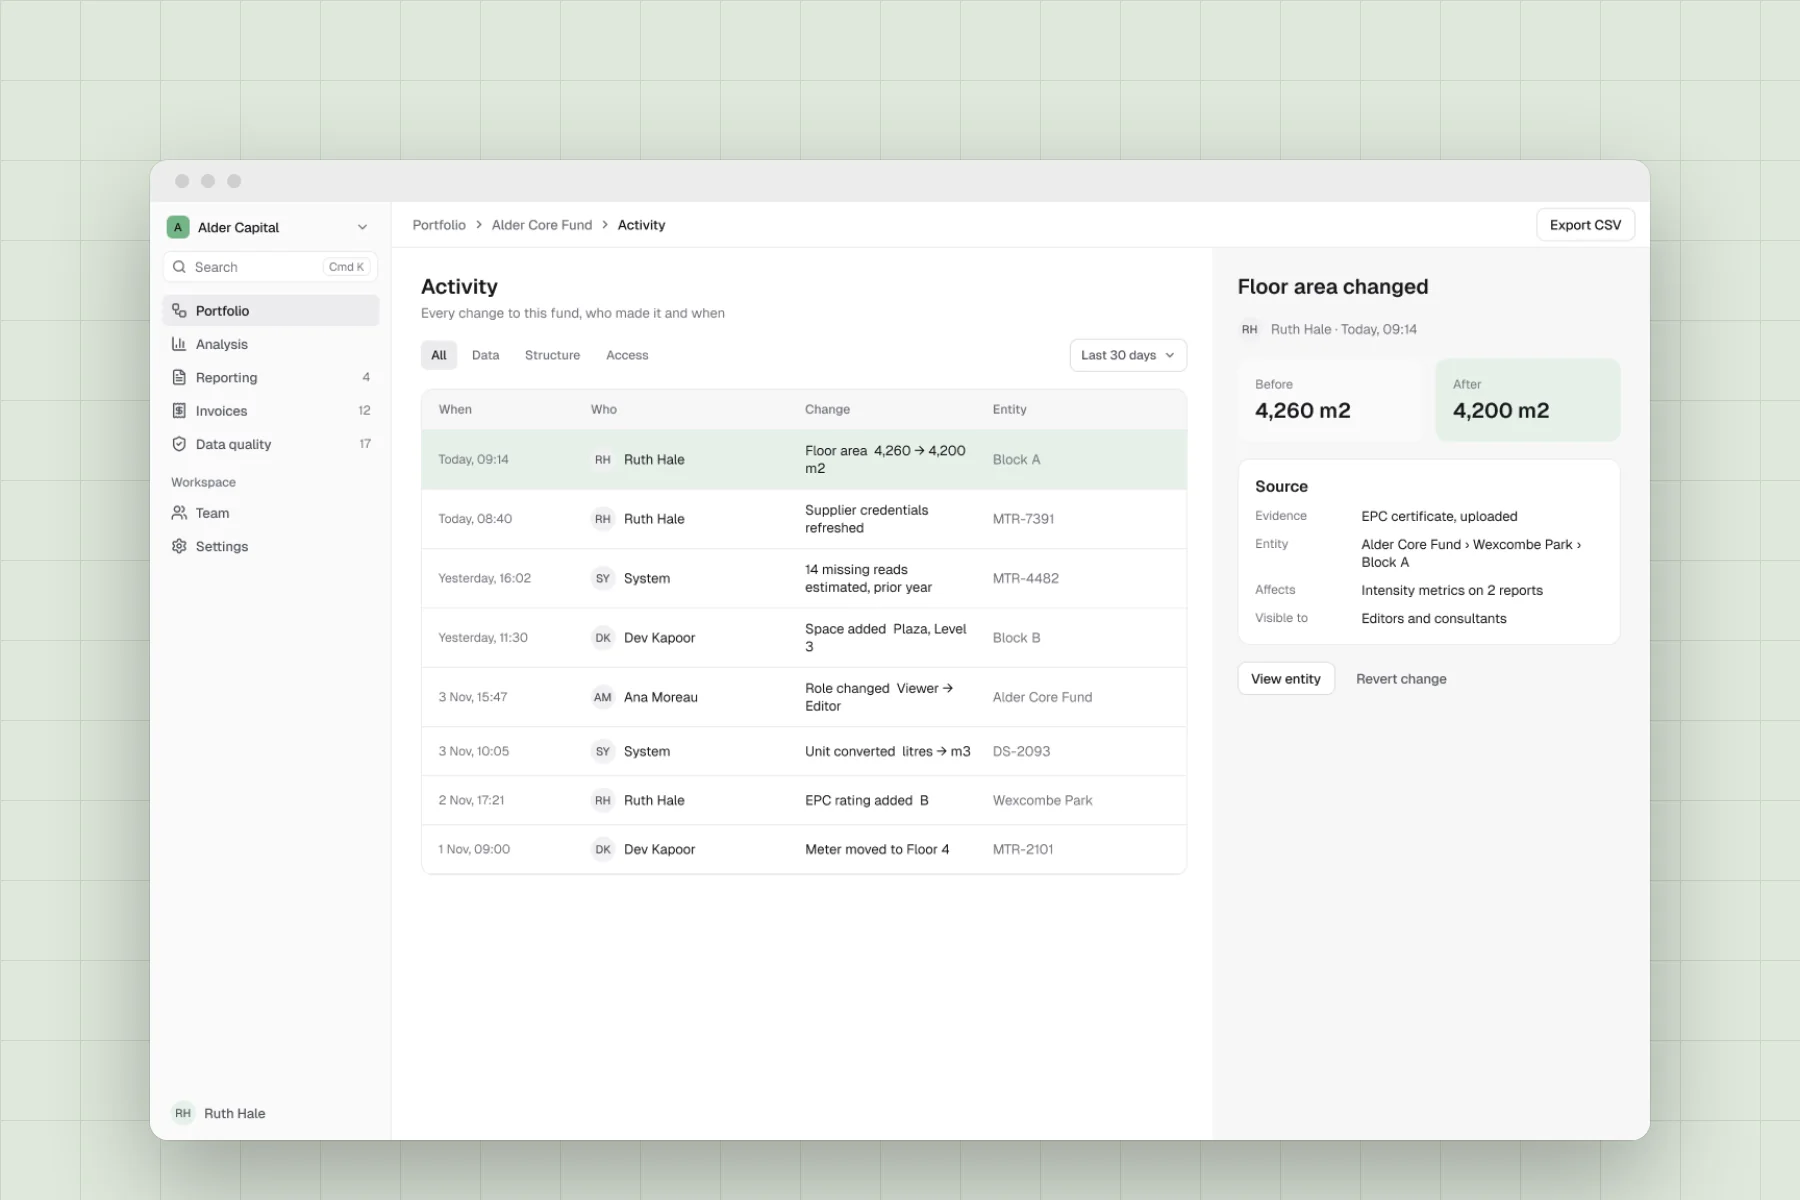
Tables handle the data and a canvas handles the relationships: two views of the same data, with the selection kept between them. Drafts are a first-class state, so partial entities show everywhere, with prompts tied to what a report actually needs. A self-serve Actions panel lets customers retry and diagnose failed meters without raising a ticket. One thing we cut was the six-step setup wizard, which no tester finished; per-entity creation, with drafts by default, replaced it.
Outcome
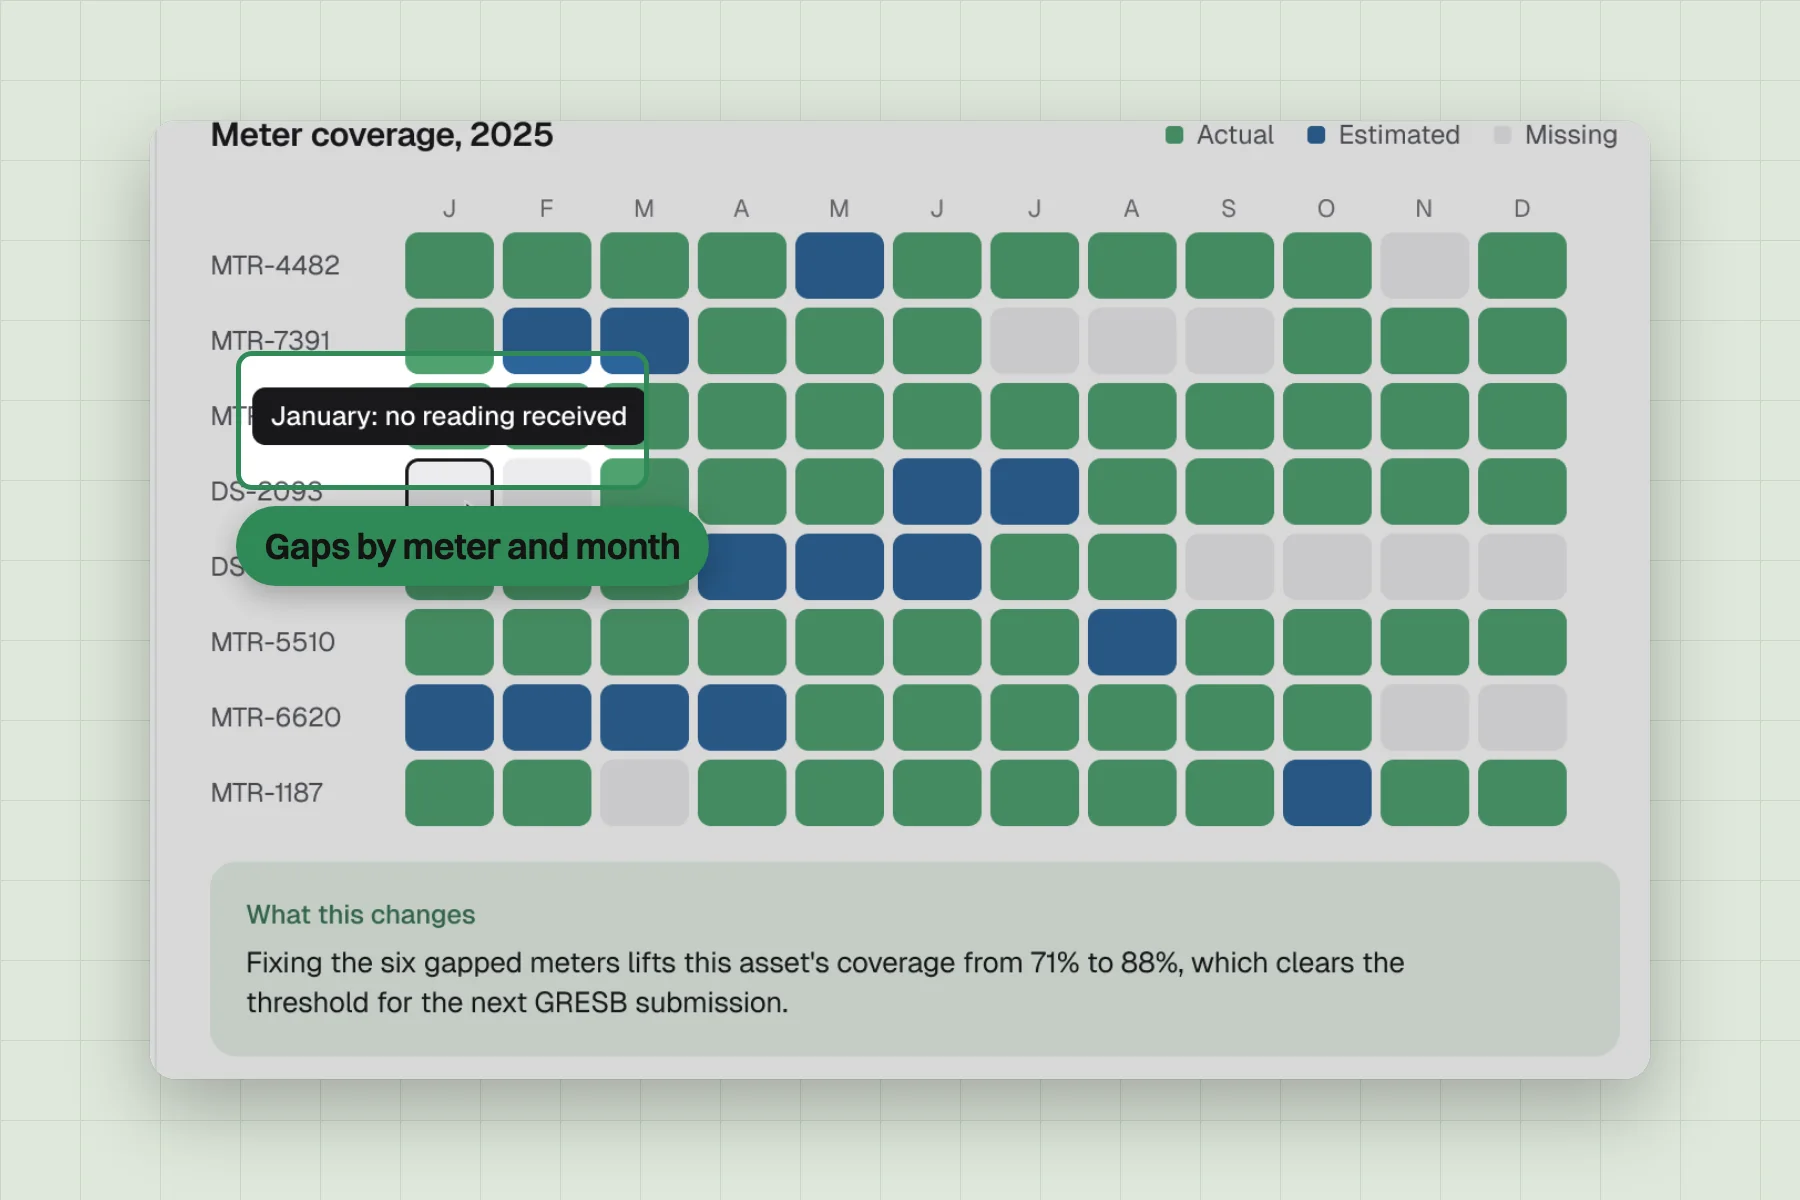
Customers could see how their portfolio was structured, level by level. Gaps in the data showed up where they sat, by meter and month. Onboarding no longer waited for a complete data set before anything appeared.
Customers stopped relying on a parallel spreadsheet, and the entity tree became the version of the portfolio they trusted. That is what made the analytics layer possible.